Powered By Blogger

Sonntag, 3. September 2017

5000 YEARS OF TSUNAMIS IN INDONESIA

Indonesian Cave Reveals Nearly 5,000 Years of Tsunamis

Researchers explore a coastal cave containing layers of sand deposited by 11 prehistoric tsunamis and demonstrate that the time period between massive waves is highly variable.
By
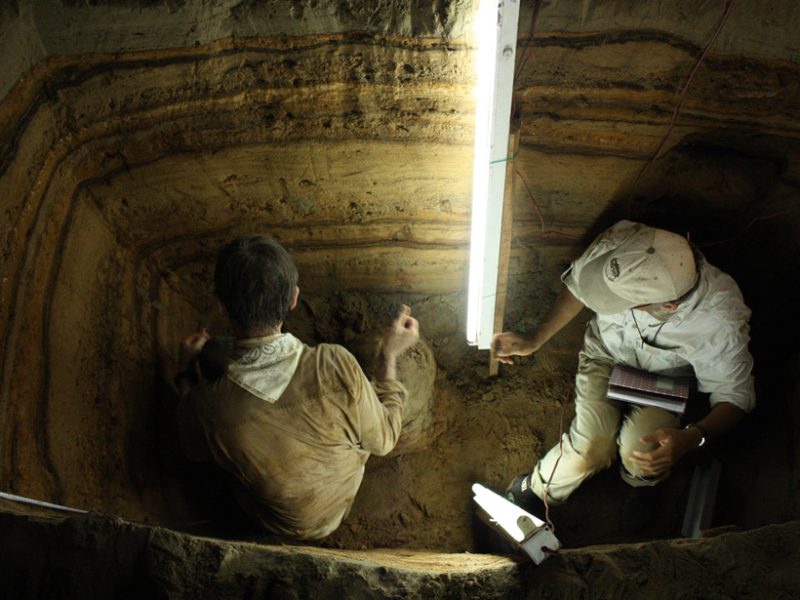
The cave didn’t look that promising from the outside, Charlie Rubin remembers. But when the earthquake geologist and his colleagues walked in and started digging, “our jaws dropped,” he said. The researchers noticed that a depression in the floor of the cave—near Banda Aceh, Indonesia—contained distinct stratigraphy: dark layers of organic material separated by clearly defined layers of lighter-colored sand.
“We looked at each other and wondered if the sand was tsunami sand,” Rubin said. After closer examination, the team members realized they had found a natural record of tsunamis sweeping sand repeatedly into the cave over thousands of years. By radiocarbon dating the sandy layers, the researchers were able to achieve what’s often thought of as a holy grail in tsunami science: a reconstruction of when previous tsunamis occurred thousands of years in the past.

Rubin and his colleagues showed that at least 11 tsunamis had swept over the region over a span of about 5,000 years. But the massive waves were not regular in time: Periods of calm ranged from millennia to merely decades. This finding—that tsunami recurrence intervals are highly variable—is proof that regional hazard mitigation plans should be based on the high likelihood of future destructive tsunamis rather than estimates of recurrence intervals, the team suggests. That’s particularly important in the Indian Ocean, a region that’s prone to megathrust earthquakes and, accordingly, large tsunamis. Those massive waves include the deadliest tsunami in history, which was unleashed in 2004 not far offshore from where the cave is located and which killed more than 200,000 people.
The geological record contained within the Banda Aceh cave is “extraordinary,” said Brian McAdoo, a tsunami scientist at Yale-NUS College in Singapore. This study also represents the first time that cave data have been used to measure tsunami recurrence intervals, McAdoo said.

A Layer Cake

In 2011 and 2012, Rubin and his colleagues excavated six trenches at the rear of the 120-meter-long coastal cave. Beneath a crust of sand topped with bat guano they dug into alternating layers of sand and organic material that reached depths of 2 meters in some places. The scientists carefully collected tiny pieces of charcoal and shells from the layers and radiocarbon dated the material in the laboratory. Using these radiocarbon measurements, the team calculated the most likely age of each of the 11 buried layers of sand and therefore the approximate date of each tsunami.

The researchers found that the 11 sand layers spanned roughly 4,500 years, from about 7,400 to 2,900 years ago. However, the guano-encrusted 12th and uppermost sand layer—which contained shreds of clothing, suggesting it was deposited very recently—differed from the stack of alternating deposits beneath it: Its bottom face was jagged and irregular, unlike the smooth boundaries between the deeper layers.
The scientists suspect that this irregularity resulted from powerful waves from the 2004 tsunami triggered by the Sumatra-Andaman earthquake sweeping into the cave, scraping away previously deposited material, and literally erasing the geological record laid down after 900 BCE. The older layers of sand were probably never disrupted in a similar way because they’re located in a natural depression in the cave, Rubin said. “They’re packed down and they’re protected.”
The research team reported its findings last month in Nature Communications.

Far from Constant

Rubin and his team showed that the time span between successive tsunamis is far from constant: Although 10 intervals within 4,500 years breaks down to an average of 450 years between the events, the researchers found evidence of one 2,000-year period free of tsunamis and also a single century that saw four tsunamis.  “This study provides new evidence that tsunami recurrence can be highly variable,” said Katrin Monecke, a geoscientist at Wellesley College in Wellesley, Mass.
The researchers, who included experts in earthquake science, hypothesized that the thickness of each sand layer reflects the magnitude of the tsunami-causing earthquake because a larger earthquake would produce a larger tsunami and therefore plausibly transport more sand into the cave. According to this theory, the thickest sand layer, measuring roughly 25 centimeters, should correspond to the strongest earthquake that occurred within the nearly 5,000 years of history recorded in the cave.

The scientists inferred that no tsunamis occurred for more than 2,100 years after this thickest layer of sand was laid down. This extremely long interseismic gap is consistent with a period of reduced stress along faults—and therefore of a lower probability of another quake—after a massive temblor released a large amount of energy, the team suggests. Conversely, the researchers found that the four sand layers corresponding to the four tsunamis that occurred within 100 years of each other were all thin (fewer than 10 centimeters), which makes sense, they argued in their paper, because short interseismic periods are consistent with weaker earthquakes.
Rubin said he and his colleagues hope to find additional caves containing evidence of past subduction zone earthquakes. Although other complementary techniques exist for determining that tsunamis occurred in the past, for example, oral histories and chemical analysis, Rubin and his team are excited to literally dig into the past. “The only way to get at tsunami older than historical records is with geology,” Rubin said.
—Katherine Kornei (email: hobbies4kk@gmail.com; @katherinekornei), Freelance Science Journalist
Citation: Kornei, K. (2017), Indonesian cave reveals nearly 5,000 years of tsunamis, Eos, 98, https://doi.org/10.1029/2017EO079283. Published on 07 August 2017.
© 2017. The authors. CC BY-NC-ND 3.0

THE NICARAGUA TSUNAMI 1992


The Legacy of the 1992 Nicaragua Tsunami

A powerful tsunami struck Nicaragua’s Pacific coast 25 years ago. In its wake emerged the first coordinated collaboration among international tsunami scientists.
By , Paula Dunbar, Kelly Stroker, and Laura Kong
On the night of 1 September 1992, a deadly tsunami struck the Pacific coast of Nicaragua with little or no warning, triggered by a nearby earthquake. Early newspaper reports indicated waves almost 15 meters high swept away houses, boats, vehicles, and anything in their path [Globe and Mail, 1992].
The earthquake and tsunami left at least 170 people dead, approximately 500 injured, and more than 13,500 homeless. The tsunami caused most of the damage.
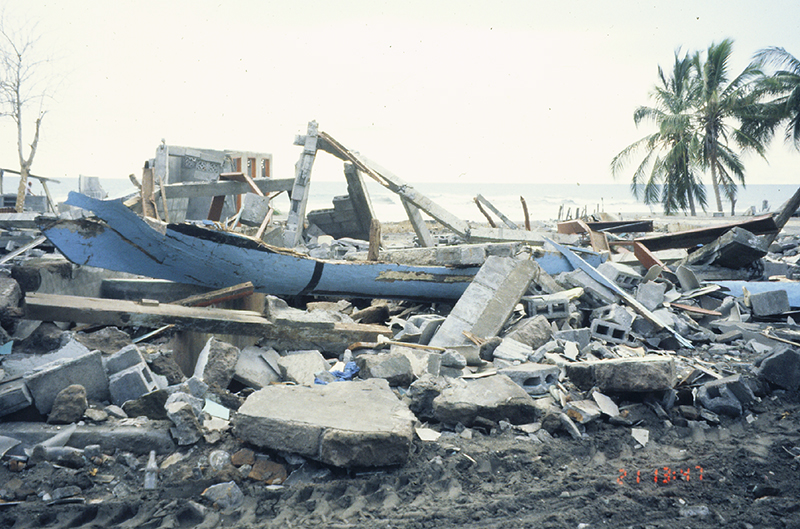
A boat perches on the ruins of a structure in the town of El Transito, Nicaragua. Runups here reached a height of nearly 10 meters.
A boat perches on the ruins of a structure in the town of El Transito, Nicaragua. Runups here reached a height of nearly 10 meters. Credit: Harry Yeh/NCEI
Following the earthquake, the National Oceanic and Atmospheric Administration (NOAA) Pacific Tsunami Warning Center (PTWC) did not issue a tsunami warning. That’s because the earthquake’s initial surface wave magnitude (Ms) was only 6.8 and lower than their warning threshold. However, analysis of seismic signatures would later show that the earthquake’s moment magnitude (Mw), a better representation of the total energy radiated by the earthquake, was 7.7.

Close to the source, many people also underestimated the magnitude of the earthquake on the basis of the shaking. Often, strong earthquake ground shaking serves as a natural warning sign of an impending tsunami, so that coastal communities can evacuate. But in this case the ground shaking was weak or soft. The source was only about 100 kilometers away, so why didn’t many coastal residents feel the earthquake, and why was the ensuing tsunami so high?
The unusual earthquake source characteristics and growing interest in tsunamis in the United States led to the organization of the first International Tsunami Survey Team (ITST) to document the tsunami’s effects. For the 25th anniversary of this event, we interviewed several Japanese and U.S. scientists involved with assessing the tsunami that followed this earthquake. From their accounts, we learned that ascertaining why coastal residents didn’t feel the earthquake greatly improved the ways scientists study tsunami generation and coordinate post-tsunami surveys today.

A Slowly Unrolling Earthquake

In a typical earthquake tsunami sequence, communities near the source feel the earthquake and, if properly alerted to their hazards, brace for the possibility of a tsunami. But the 1992 Nicaragua earthquake, which occurred on 2 September at 00:16 coordinated universal time (1 September at 19:16 local time), did not follow this typical pattern.
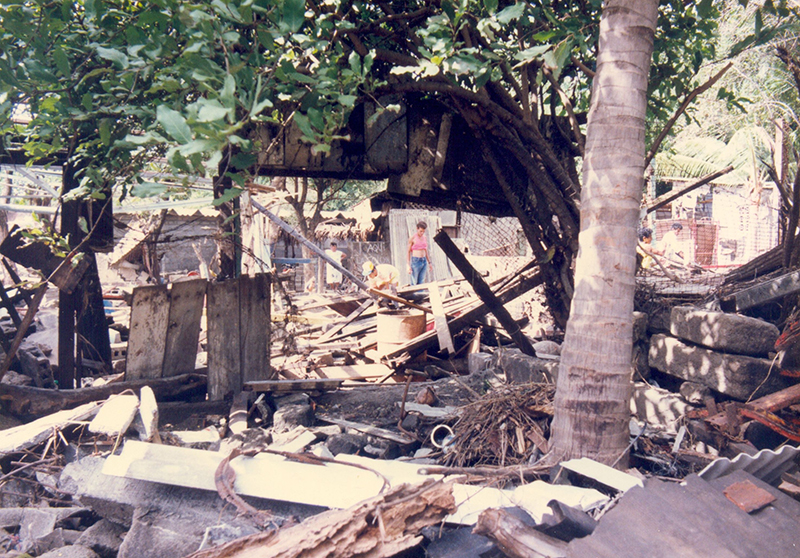
Destruction seen in the town of Masachapa, Nicaragua, the morning after the 1 September 1992 tsunami.
Destruction seen in the town of Masachapa, Nicaragua, the morning after the 1 September 1992 tsunami. Credit: Wilfried Strauch/INETER
“We found only about half the coastal residents actually felt the ground shaking,” recalled Kenji Satake, then a seismologist at the University of Michigan, who participated in the post-tsunami survey.
To understand what happened, one needs to look to a paper published 20 years prior to the events that preceded the 1992 Nicaragua tsunami. In 1972, Hiroo Kanamori, then at Japan’s Earthquake Research Institute of the University of Tokyo, proposed the term “tsunami earthquake“ [Kanamori, 1972]. In such earthquakes, fault rupture occurs more slowly and gradually than it normally would during a typical tectonic earthquake. Measurements of just the short-period seismic waves will not adequately capture this slow release of energy, so a tsunami triggered by such an earthquake is larger and runs up higher than one would expect from quick calculations of Ms.
Prior to 1992, scientists knew about tsunami earthquakes, but they hadn’t really observed seismograms where one unfolded or developed methods for quickly calculating a reliable magnitude when the largest energy is released later. The 1992 earthquake in Nicaragua changed that.
Newly developed broadband seismometers with digital acquisition systems enabled the tracking of the Nicaragua earthquake over multiple frequencies. The seismometers told an intriguing story: “We knew from our seismogram analysis that the source process was unusual, characterized by long duration,” Satake noted.

There it was: The first tsunami earthquake ever recorded by broadband seismometers [Kanamori and Kikuchi, 1993].
In this context, it made sense that many residents didn’t feel the ground shaking. The earthquake was slow, but it packed a big punch that triggered a destructive tsunami where none was expected [Satake, 1994].

The First International Tsunami Survey Team

The gradual release of energy during the 1992 Nicaragua earthquake resulted in underestimated early magnitude assessments because much of the energy was contained in longer-period waves. In 1992, PTWC calculated magnitudes using the 1-second short-period P waves and 20-second period surface waves. Thus, scientists did not know the Ms until 30 to 40 minutes after the earthquake, and when determined, it was below the tsunami warning threshold, recalled Laura Kong, who was on duty at PTWC for the event. As a result, the initial earthquake magnitude calculated did not tip off the scientific community about the possibility of a destructive tsunami.
Because scientists were not tipped off, most of the world outside of Nicaragua heard about the tsunami through news media. Inside the country, however, Wilfried Strauch, a geophysicist at Nicaragua’s Instituto Nicaragüense de Estudios Territoriales (INETER), felt the long earthquake. After hearing on the radio about inundations along the coast, Strauch gathered his equipment and immediately left for the coast. Accompanied by the military, Strauch was among the first scientists and officials to confirm the tsunami’s destruction at sunrise.
A resident assesses damage in San Juan del Sur, Nicaragua, days after the 1 September 1992 tsunami.
A resident assesses damage in San Juan del Sur, Nicaragua, days after the 1 September 1992 tsunami. Credit: Wilfried Strauch/INETER
Fumihiko Imamura, an engineering professor at Tohoku University, was in Japan when he learned of the tsunami from news broadcasts. He had also noted a 7-centimeter rise in a tide gauge moored near Kesennuma, Japan. This blip was the event’s teletsunami, observed more than 12,000 kilometers from its Nicaraguan source. Working backward, far-field tide gauge observations were inverted to estimate the magnitude of the source. These calculations indicated a higher-magnitude earthquake than was initially reported [Satake et al., 1993].
Intrigued, Imamura led one of the survey teams in Nicaragua’s affected areas. His and other teams joined a larger survey effort initiated by Kuniaki Abe (from Nippon Dental University College in Niigata, Japan) and Katsuaki Abe and Yoshinobu Tsuji (from the University of Tokyo’s Earthquake Research Institute, also in Japan). Upon hearing of the survey efforts, Satake contacted the U.S. National Science Foundation (NSF) to request permission to use grant funds to join the survey team in documenting this unusual tsunami. This request led Jody Bourgeois, a program officer at NSF at the time, to link up with the post-tsunami survey teams.
ITST member stands next to a large rock that the 1 September 1992 Nicaragua tsunami carried 50 meters inland.
A photograph taken near the town of Popoyo, Nicaragua, during the first ITST. Here Bourgeois stands next to a large rock that the 1 September 1992 tsunami carried 50 meters inland and deposited 1.85 meters above sea level. Credit: Harry Yeh/NCEI
Through this coordination, the first ITST began to take shape. Scientists and engineers from Japan and the United States, aided by local Nicaraguan scientists and engineers, surveyed the impacted areas within 3 weeks of the event.

International Collaboration

Japan has a long history of tsunami events, and Japanese scientists had done extensive research on tsunami effects before the 1992 Nicaragua event. For instance, Satake was also part of a post-tsunami survey team that documented the 1983 Sea of Japan earthquake and tsunami.
Japanese team members had a great deal of post-tsunami survey experience. In contrast, U.S. team members had little such previous experience. Although U.S. scientists surveyed the effects of the 28 March 1964 Alaska earthquake and tsunami, few destructive tsunamis had hit U.S. coasts in the decade leading up to the Nicaragua event. However, when the Nicaragua tsunami struck, there was growing interest in tsunamis among many U.S. scientists. Recent discoveries in the Cascadia Subduction Zone had revealed a tsunami that we now know struck in 1700, and many scientists were focused on reconstructing that event [Atwater, 1987].
Thus, leadership of the first ITST fell largely to Japanese scientists, given their prior tsunami experience in Japan. The Japanese members handled initial communications with Nicaraguans at INETER and benefited from previously established local connections.

However, as Frank Gonzalez, then an oceanographer at the NOAA Pacific Marine Environmental Laboratory (PMEL), recalled, the level of collaboration “was a first for everyone, so there was a lot of winging it and improvisation.”
One tricky problem to navigate was the availability and accuracy of baseline maps of the coastline. “The Nicaraguans supplied the Japanese team members with maps produced with the help of the Soviet Union,” Bourgeois recalled. “I had a set of maps produced by the U.S. government. The Nicaraguan set was more up to date from on-the-ground data because of cooperation between the Sandinista government and the U.S.S.R. We joked that the two sets were ‘KGB’ and ‘CIA.’”
Nonetheless, she noted that both sets of maps ultimately had issues with accuracy. One survey team member did have a GPS: It “was not very accurate, but then, neither were the maps,” Bourgeois said.

Results from the First ITST Survey

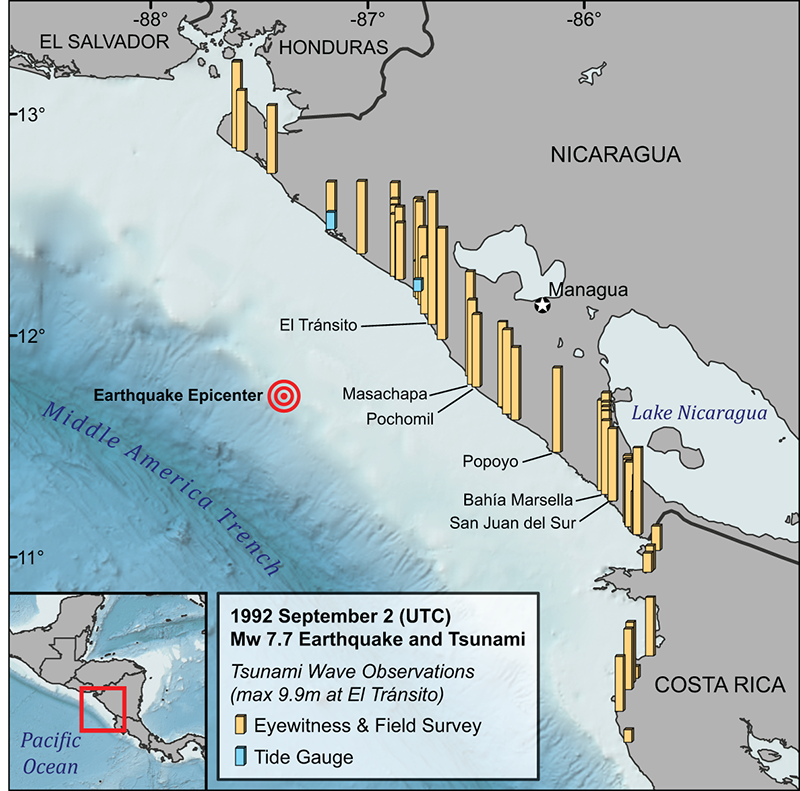
The ITST conducted its survey along more than 250 kilometers of the Nicaraguan coast. They determined the largest wave runups to be along the coast of central Nicaragua. The tsunami reached a height of 9.9 meters at El Tránsito (not 15 meters as reported in newspapers), decreasing to the north and remaining at 6 to 8 meters south to Bahía Marsella (Figure 1). These runup locations are stored in the NOAA National Centers for Environmental Information (NCEI)/World Data Service (WDS) Global Historical Tsunami Database [NCEI/WDS, 2017].
Tsunami wave observations from the 1 September 1992 Nicaragua earthquake and tsunami along the coasts of Nicaragua and Costa Rica.
Fig. 1. Tsunami wave observations from the 1 September 1992 Nicaragua earthquake and tsunami along the coasts of Nicaragua and Costa Rica. The length of bars indicates the relative runup height of the tsunami, with the maximum height of nearly 10 meters observed at El Tránsito, Nicaragua. Data were pulled from the NCEI/WDS Global Historical Tsunami Database. Credit: NCEI
At El Tránsito, 80% of the buildings were swept away. Walls of water were reported at Masachapa, Pochomil, and San Juan del Sur, all of which have shallow ocean depths near the coast. “I was floored by the damage,” reflects Bourgeois. “I was impressed with how building structure had a lot to do with tsunami resilience: open lower floors and houses with breezeways perpendicular to the beach could survive where other houses were obliterated. It wasn’t until I returned in February 1993, though, that I realized that some places where I had seen foundations had actually been standing houses before the tsunami.”
After the 1 September 1992 tsunami in Nicaragua, ITST members note the only two houses in Popoyo that survived.
Three weeks after the 1 September 1992 tsunami in Nicaragua, ITST members document two houses in Popoyo that survived—all the others were washed away. Credit: Harry Yeh/NCEI
Costa Rica also experienced some tsunami damage, and the ITST sent a small group to survey the area. The group faced many challenges, including transport and border crossings that were open irregularly, but they managed to collect and report the data.

An Early Example of a Listserv

After the tsunami, Gonzalez and his team at PMEL developed what is now considered an Internet listserv. The forum, then called the Nicaragua Bulletin Board (or Tsu-Nica), was used to exchange data and manuscripts.

Although these forums are common today, such a listserv was groundbreaking at the time. “It was the beginning of communication among tsunami scientists through the Internet,” Satake said.
This listserv continues today, now called the Tsunami Bulletin Board (TBB). Since 1995, the service has been hosted by the NOAA International Tsunami Information Center (ITIC). The TBB continues to be the main platform for sharing tsunami event information and coordinating post-tsunami surveys. Of course, Tsu-Nica did not solve all coordination and data-sharing problems, but it was an important first step.

Development of a Post-tsunami Survey Field Guide

Three years later, in June 1995, tsunami scientists from 10 countries participated in an International Tsunami Measurements workshop in Estes Park, Colo. This workshop started the development of a post-tsunami survey manual to provide guidance on conducting a survey, including logistics, techniques, and challenges.
In 1998, ITIC and the United Nations Educational, Scientific and Cultural Organization’s Intergovernmental Oceanographic Commission (IOC) published the first edition of the Post-tsunami Survey Field Guide using experience gained from the Nicaragua ITST [IOC, 1998]. Much of the guidance included was based on the work of the first ITST in Nicaragua. For example, Japanese scientists “had a questionnaire which became the basis for future questionnaires,” noted Bourgeois, who attended the 1995 workshop.
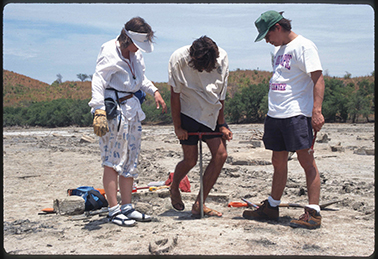
Scientists take a core of coastal sediments during a return survey in 1995 to areas affected by the 1992 Nicaragua tsunami.
Following the 1992 ITST, Bourgeois returned to Nicaragua twice to study tsunami deposits. This photograph from March 1995 shows Bourgeois (left) in Nicaragua with then University of Southern California researchers José Borrero (middle) and Paul Merculief (right). The scientists are taking a core of coastal sediments to look for tsunami deposits. Credit: Costas Synolakis and ITIC
As the years passed, many scientists contributed to updating the guide, using their experiences from many events. These events include the 2004 Indian Ocean, 2007 Solomon Islands, 2009 Samoa, 2010 Chile, and 2011 Japan tsunamis.

The Legacy of the First Survey

The 1992 ITST focused on collecting water height, maximum inundation, and runup data. In the 25 years since this first survey, much has evolved. Bourgeois was the only sedimentary geologist on the 1992 ITST, but now post-tsunami surveys regularly survey geologic effects (e.g., deposits and erosion) of tsunamis. Social scientists, economists, ecologists, and engineers are now commonly involved in ITSTs. In addition, scientists are gathering eyewitness accounts from those who remember tsunamis that occurred in their childhoods, before modern instrumentation. All these efforts help communities better understand their long-term hazards.

Reflecting on surveys then and now, Gonzalez remarked, “the tsunami community is now much more professionally diverse: not only engineers and oceanographers, but biologists, social scientists, etc. This is as it should be. Tsunamis know no borders, and no single profession can span all tsunami causes and effects.”
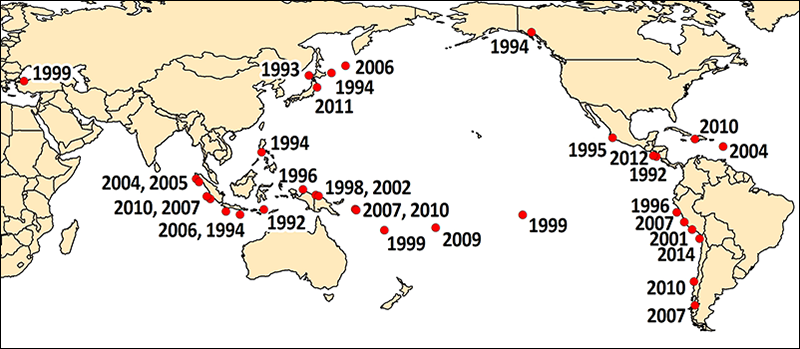
Since 1992, ITSTs have documented a total of 33 tsunami events in the Pacific and Indian oceans and the Caribbean and Mediterranean seas (Figure 2) [IOC, 2014]. To ensure easy access to data, the number of deaths, injuries, economic losses, and buildings damaged reported in ITSTs are now collected in the NCEI/WDS Global Historical Tsunami Database.
Spatial distribution and dates of ITSTs
Fig. 2. Spatial distribution and dates of ITSTs. Credit: NCEI
In short, from scrappy beginnings, a robust, coordinated post-tsunami survey system has emerged.

From Tragedy to Inspiration

The 1992 Nicaragua earthquake and tsunami were tragic events for the people of this Central American country. They brought to focus research on tsunami earthquakes, which remains a “blind spot on local tsunami warnings,” Satake noted. Through the earthquake’s analysis and first ever ITST, scientists took the first steps toward understanding these dangerous events.
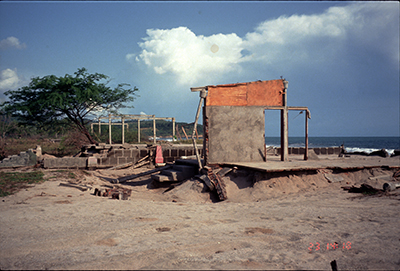
A lone wall stands on a foundation in Popoyo 3 weeks after the 1 September 1992 tsunami.
A lone wall stands on a foundation in Popoyo 3 weeks after the 1 September 1992 tsunami. Credit: Harry Yeh/NCEI
From this tragedy, many new systems have grown. The event led to the creation of a national tsunami warning system in Nicaragua, and it planted the seeds of the new Central America Tsunami Advisory Centre (CATAC), a project under development with Japanese support and hosted by Nicaragua’s INETER.
But perhaps the most enduring legacy of the 1992 Nicaragua earthquake and tsunami is their impact on how we now survey tsunamis. Post-tsunami surveys are now coordinated, interdisciplinary, international efforts. In some cases, the affected country may even request IOC and ITIC assist coordination efforts. The collection of perishable tsunami data has benefited from improved measurement capabilities (e.g., differential GPS and integrated laser range finders), leading to a better understanding of tsunamis. Moreover, the ITSTs have underscored to researchers the importance and duty of sharing data with one another through emerging technologies.
Better hazard management stems from coordinated scientific focus. The events 25 years ago in Nicaragua demonstrate this and serve as an enduring example of how collaboration yields information that may ultimately save lives.

References

Atwater, B. F. (1987), Evidence for great Holocene earthquakes along the outer coast of Washington State, Science, 236(4804), 942–944, https://doi.org/10.1126/science.236.4804.942.
Globe and Mail (1992), Tidal waves hit Nicaragua in aftermath of earthquake more than 200 dead or missing as Pacific coast is ravaged, Globe and Mail, 3 Sept.
Intergovernmental Oceanographic Commission (IOC) (1998), Post-tsunami Survey Field Guide, 1st ed., IOC Man. Guides, vol. 37, U. N. Educ., Sci. and Cultural Organ., Paris.
Intergovernmental Oceanographic Commission (IOC) (2014), International Tsunami Survey Team (ITST) Post-tsunami Survey Field Guide, 2nd ed., IOC Man. Guides, vol. 37, U. N. Educ., Sci. and Cultural Organ., Paris.
Kanamori, H. (1972), Mechanism of tsunami earthquakes, Phys. Earth Planet. Inter., 6(5), 346–359, https://doi.org/10.1016/0031-9201(72)90058-1.
Kanamori, H., and M. Kikuchi (1993), The 1992 Nicaragua earthquake: A slow tsunami earthquake associated with subducted sediments, Nature, 361(6414), 714–716, https://doi.org/10.1038/361714a0.
National Centers for Environmental Information/World Data Service (NCEI/WDS) (2017), Global Historical Tsunami Database, Natl. Cent. for Environ. Inf., Boulder, Colo., doi:10.7289/V5PN93H7. [Accessed 7 August 2017.]
Satake, K. (1994), Mechanism of the 1992 Nicaragua tsunami earthquake, Geophys. Res. Lett., 21(23), 2519–2522, https://doi.org/10.1029/94GL02338.
Satake, K., et al. (1993), Tsunami field survey of the 1992 Nicaragua earthquake, Eos Trans. AGU, 74(13), 145, 156–157, https://doi.org/10.1029/93EO00271.

Author Information

Nicolas Arcos (email: nicolas.arcos@noa.gov), Paula Dunbar, and Kelly Stroker, National Centers for Environmental Information, National Oceanic and Atmospheric Administration (NOAA), Boulder, Colo.; also at Cooperative Institute for Research in Environmental Sciences, University of Colorado Boulder; and Laura Kong, International Tsunami Information Center, NOAA, Honolulu, Hawaii

Citation: Arcos, N., P. Dunbar, K. Stroker, and L. Kong (2017), The legacy of the 1992 Nicaragua tsunami, Eos, 98, https://doi.org/10.1029/2017EO080845. Published on 30 August 2017.
© 2017. The authors. CC BY-NC-ND 3.0

MEASURING THE EARTHQUAK'S SIZE

Seismic waves are the vibrations from earthquakes that travel through the Earth; they are recorded on instruments called seismographs. Seismographs record a zig-zag trace that shows the varying amplitude of ground oscillations beneath the instrument. Sensitive seismographs, which greatly magnify these ground motions, can detect strong earthquakes from sources anywhere in the world. The time, location, and magnitude of an earthquake can be determined from the data recorded by seismograph stations.
Modern seismographic systems precisely amplify and record ground motion (typically at periods of between 0.1 and 100 seconds) as a function of time.
Earthquakes with magnitude of about 2.0 or less are usually called microearthquakes; they are not commonly felt by people and are generally recorded only on local seismographs. Events with magnitudes of about 4.5 or greater - there are several thousand such shocks annually - are strong enough to be recorded by sensitive seismographs all over the world. Great earthquakes, such as the 1964 Good Friday earthquake in Alaska, have magnitudes of 8.0 or higher. On the average, one earthquake of such size occurs somewhere in the world each year.

The Richter Scale

Although similar seismographs had existed since the 1890's, it was only in 1935 that Charles F. Richter, a seismologist at the California Institute of Technology, introduced the concept of earthquake magnitude. His original definition held only for California earthquakes occurring within 600 km of a particular type of seismograph (the Woods-Anderson torsion instrument). His basic idea was quite simple: by knowing the distance from a seismograph to an earthquake and observing the maximum signal amplitude recorded on the seismograph, an empirical quantitative ranking of the earthquake's inherent size or strength could be made. Most California earthquakes occur within the top 16 km of the crust; to a first approximation, corrections for variations in earthquake focal depth were, therefore, unnecessary.
The Richter magnitude of an earthquake is determined from the logarithm of the amplitude of waves recorded by seismographs. Adjustments are included for the variation in the distance between the various seismographs and the epicenter of the earthquakes. On the Richter Scale, magnitude is expressed in whole numbers and decimal fractions. For example, a magnitude 5.3 might be computed for a moderate earthquake, and a strong earthquake might be rated as magnitude 6.3. Because of the logarithmic basis of the scale, each whole number increase in magnitude represents a tenfold increase in measured amplitude; as an estimate of energy, each whole number step in the magnitude scale corresponds to the release of about 31 times more energy than the amount associated with the preceding whole number value.
The Richter Scale is not commonly used anymore, except for small earthquakes recorded locally, for which ML and Mblg are the only magnitudes that can be measured. For all other earthquakes, the moment magnitude scale is a more accurate measure of the earthquake size. More on that later.

Magnitude

Richter's original magnitude scale (ML) was extended to observations of earthquakes of any distance and of focal depths ranging between 0 and 700 km. Because earthquakes excite both body waves, which travel into and through the Earth, and surface waves, which are constrained to follow the natural wave guide of the Earth's uppermost layers, two magnitude scales evolved - the mb and MS scales.
The standard body-wave magnitude formula is
mb = log10(A/T) + Q(D,h) ,
where A is the amplitude of ground motion (in microns); T is the corresponding period (in seconds); and Q(D,h) is a correction factor that is a function of distance, D (degrees), between epicenter and station and focal depth, h (in kilometers), of the earthquake. The standard surface-wave formula is
MS = log10 (A/T) + 1.66 log10 (D) + 3.30 .
There are many variations of these formulas that take into account effects of specific geographic regions, so that the final computed magnitude is reasonably consistent with Richter's original definition of ML. Negative magnitude values are permissible.
A rough idea of frequency of occurrence of large earthquakes is given by the following table:
MSEarthquakes per year
8.5 - 8.90.3
8.0 - 8.41.1
7.5 - 7.93.1
7.0 - 7.415
6.5 - 6.956
6.0 - 6.4210

This table is based on data for a recent 47 year period. Perhaps the rates of earthquake occurrence are highly variable and some other 47 year period could give quite different results.
The original mb scale utilized compressional body P-wave amplitudes with periods of 4-5 s, but recent observations are generally of 1 s-period P waves. The MS scale has consistently used Rayleigh surface waves in the period range from 18 to 22 s.
When initially developed, these magnitude scales were considered to be equivalent; in other words, earthquakes of all sizes were thought to radiate fixed proportions of energy at different periods. But it turns out that larger earthquakes, which have larger rupture surfaces, systematically radiate more long-period energy. Thus, for very large earthquakes, body-wave magnitudes badly underestimate true earthquake size; the maximum body-wave magnitudes are about 6.5 - 6.8. In fact, the surface-wave magnitudes underestimate the size of very large earthquakes; the maximum observed values are about 8.3 - 8.7. Some investigators have suggested that the 100 s mantle Love waves (a type of surface wave) should be used to estimate magnitude of great earthquakes. However, even this approach ignores the fact that damage to structure is often caused by energy at shorter periods. Thus, modern seismologists are increasingly turning to two separate parameters to describe the physical effects of an earthquake: seismic moment and radiated energy.
Fault Geometry and Seismic Moment, MO
The orientation of the fault, direction of fault movement, and size of an earthquake can be described by the fault geometry and seismic moment. These parameters are determined from waveform analysis of the seismograms produced by an earthquake. The differing shapes and directions of motion of the waveforms recorded at different distances and azimuths from the earthquake are used to determine the fault geometry, and the wave amplitudes are used to compute moment. The seismic moment is related to fundamental parameters of the faulting process.
MO = µS‹d› ,
where µ is the shear strength of the faulted rock, S is the area of the fault, and <d> is the average displacement on the fault. Because fault geometry and observer azimuth are a part of the computation, moment is a more consistent measure of earthquake size than is magnitude, and more importantly, moment does not have an intrinsic upper bound. These factors have led to the definition of a new magnitude scale MW, based on seismic moment, where
MW = 2/3 log10(MO) - 10.7 .
The two largest reported moments are 2.5 X 1030 dyn·cm (dyne·centimeters) for the 1960 Chile earthquake (MS 8.5; MW 9.6) and 7.5 X 1029 dyn·cm for the 1964 Alaska earthquake (MS 8.3; MW 9.2). MS approaches its maximum value at a moment between 1028 and 1029 dyn·cm.
Energy, E
The amount of energy radiated by an earthquake is a measure of the potential for damage to man-made structures. Theoretically, its computation requires summing the energy flux over a broad suite of frequencies generated by an earthquake as it ruptures a fault. Because of instrumental limitations, most estimates of energy have historically relied on the empirical relationship developed by Beno Gutenberg and Charles Richter:
log10E = 11.8 + 1.5MS
where energy, E, is expressed in ergs. The drawback of this method is that MS is computed from an bandwidth between approximately 18 to 22 s. It is now known that the energy radiated by an earthquake is concentrated over a different bandwidth and at higher frequencies. With the worldwide deployment of modern digitally recording seismograph with broad bandwidth response, computerized methods are now able to make accurate and explicit estimates of energy on a routine basis for all major earthquakes. A magnitude based on energy radiated by an earthquake, Me, can now be defined,
Me = 2/3 log10E - 2.9.
For every increase in magnitude by 1 unit, the associated seismic energy increases by about 32 times.
Although Mw and Me are both magnitudes, they describe different physical properites of the earthquake. Mw, computed from low-frequency seismic data, is a measure of the area ruptured by an earthquake. Me, computed from high frequency seismic data, is a measure of seismic potential for damage. Consequently, Mw and Me often do not have the same numerical value.
Intensity
The increase in the degree of surface shaking (intensity) for each unit increase of magnitude of a shallow crustal earthquake is unknown. Intensity is based on an earthquake's local accelerations and how long these persist. Intensity and magnitude thus both depend on many variables that include exactly how rock breaks and how energy travels from an earthquake to a receiver. These factors make it difficult for engineers and others who use earthquake intensity and magnitude data to evaluate the error bounds that may exist for their particular applications.
An example of how local soil conditions can greatly influence local intensity is given by catastrophic damage in Mexico City from the 1985, MS 8.1 Mexico earthquake centered some 300 km away. Resonances of the soil-filled basin under parts of Mexico City amplified ground motions for periods of 2 seconds by a factor of 75 times. This shaking led to selective damage to buildings 15 - 25 stories high (same resonant period), resulting in losses to buildings of about $4.0 billion and at least 8,000 fatalities.
The occurrence of an earthquake is a complex physical process. When an earthquake occurs, much of the available local stress is used to power the earthquake fracture growth to produce heat rather than to generate seismic waves. Of an earthquake system's total energy, perhaps 10 percent to less that 1 percent is ultimately radiated as seismic energy. So the degree to which an earthquake lowers the Earth's available potential energy is only fractionally observed as radiated seismic energy.
Determining the Depth of an Earthquake
Earthquakes can occur anywhere between the Earth's surface and about 700 kilometers below the surface. For scientific purposes, this earthquake depth range of 0 - 700 km is divided into three zones: shallow, intermediate, and deep.
Shallow earthquakes are between 0 and 70 km deep; intermediate earthquakes, 70 - 300 km deep; and deep earthquakes, 300 - 700 km deep. In general, the term "deep-focus earthquakes" is applied to earthquakes deeper than 70 km. All earthquakes deeper than 70 km are localized within great slabs of shallow lithosphere that are sinking into the Earth's mantle.
The evidence for deep-focus earthquakes was discovered in 1922 by H.H. Turner of Oxford, England. Previously, all earthquakes were considered to have shallow focal depths. The existence of deep-focus earthquakes was confirmed in 1931 from studies of the seismograms of several earthquakes, which in turn led to the construction of travel-time curves for intermediate and deep earthquakes.
The most obvious indication on a seismogram that a large earthquake has a deep focus is the small amplitude, or height, of the recorded surface waves and the uncomplicated character of the P and S waves. Although the surface-wave pattern does generally indicate that an earthquake is either shallow or may have some depth, the most accurate method of determining the focal depth of an earthquake is to read a depth phase recorded on the seismogram.
The most characteristic depth phase is pP. This is the P wave that is reflected from the surface of the Earth at a point relatively near the epicenter. At distant seismograph stations, the pP follows the P wave by a time interval that changes slowly with distance but rapidly with depth. This time interval, pP-P (pP minus P), is used to compute depth-of-focus tables. Using the time difference of pP-P as read from the seismogram and the distance between the epicenter and the seismograph station, the depth of the earthquake can be determined from published travel-time curves or depth tables.
Another seismic wave used to determine focal depth is the sP phase - an S wave reflected as a P wave from the Earth's surface at a point near the epicenter. This wave is recorded after the pP by about one-half of the pP-P time interval. The depth of an earthquake can be determined from the sP phase in the same manner as the pP phase by using the appropriate travel-time curves or depth tables for sP.
If the pP and sP waves can be identified on the seismogram, an accurate focal depth can be determined.
by William Spence, Stuart A. Sipkin, and George L. Choy
Earthquakes and Volcanoes
Volume 21, Number 1, 1989

 https://earthquake.usgs.gov/learn/topics/measure.php?t=1&cn=ZmxleGlibGVfcmVjc18y&refsrc=email&iid=a14d6618cc7248399e8eb5baa382cee6&uid=765318905522946048&nid=244+272699400
Dienstag, 29. August 2017

UNISDR PREVENTION WEB & TSUNAMI CONTENT


By year

Sonntag, 2. Juli 2017

SIMPLE MODEL OF P-S-WAVES

VIDEO (00:01:15) - Where do travel time curves come from?
Dienstag, 6. Juni 2017

EARTHQUAKE M 4.7 JOLTS DELHI-NCR

Earthquake jolts Delhi-NCR (National Capital Region)

No loss of life was reported. The earthquake was felt around 4.25 am

BS Web Team 
Earthquake in Delhi-NCR
Earthquake in Delhi-NCR 
Anof 4.7 magnitude hit on Friday morning.

No loss of life and property was reported. The was felt around 4.25 am. The epicentre of the was in Gohana, Haryana.
Many people came out of their homes in panic. Tremors were felt in other parts of North India as well.

Samstag, 3. Juni 2017

BENEATH THE EARTH'S CRUST


Science

The amazing world that scientists are uncovering beneath the Earth’s crust

May 24, 2017 /


There are continents to explore right below our feet — including two giant blobs 100 times as tall as Everest. Here’s how seismologist and geophysicist Ed Garnero is studying this unseen and largely uncharted territory.

For most people, everything they know about the composition of the Earth is what they were taught in elementary school: that our planet is made up of an eggshell-like crust over a thick mantle surrounding a super-hot core. In the last decade, scientists have made some super-interesting — and even strange or profound — discoveries that can add detail to that picture. Among their recent subterranean findings are a river of liquid metal that moves more swiftly than the tectonic plates, “bubbles” at the crust-mantle boundary, a new species of mineral that is somehow capable of holding water hundreds of miles within the mantle, chambers of magma where rocks are heating up like popcorn and expelled.
A visualization of the seismic waves from six Gulf of California earthquake events, over the years of 2007 to 2013, created by a team led by Manochehr Bahavar of the IRIS Data Management Center.
Like the deep oceans, our planet’s innards are extremely difficult to study. Since humans can’t travel very far into the Earth (and certainly not the 3,963 miles to its core), investigation has largely depended upon the development of technology that can sense what lies below. The existence of tectonic plates was confirmed only around fifty years ago when sonar was used to map the ocean floor. Why is venturing below so difficult? For starters, the pressure. Just eight miles down, you’d feel the equivalent of 131 elephants of force pressing down on your head. And it’s unbearably hot. The temperature at the bottom of the top layer of the crust is roughly 1,600 degrees Fahrenheit. That’s breezy compared to the Earth’s core, which is thought to be about 10,800 degrees (as hot as the surface of the sun). So far, the farthest down that humans have tunneled is 7.6 miles.
Scientists have found two enormous, mysterious blobs of super-hot material that lie under the earth’s crust. In this visualization, seismic wave paths are shown passing through the blob. The blue and red features represent, respectively, high- and low-velocity material, discovered from tomography. Visualization by Ed Garnero.
Geophysicists use seismometers to “see” inside the Earth, similar to how X-rays see inside our bodies. We tend to think of the Earth as fairly solid, except perhaps when hit by an earthquake. In reality, though, we live on chunks of crust that are constantly doing a dance that we can’t feel but scientists are always monitoring. For example, Phoenix, Arizona, rises and falls by about 40 centimeters twice a day, due to the sun’s and moon’s gravitational pulls. And Southern California has about 10,000 earthquakes a year, most a magnitude two or less. Each of these quakes — and every rise and fall — creates seismic waves that are recorded by instruments called seismometers. Like an X-ray machine, a seismometer assesses how energy moves through an object to infer what’s happening inside that object. Right now, the Global Seismographic Network (GSN) has more than 150 seismic stations distributed throughout the world, while the Incorporated Research Institutions for Seismology (IRIS) network includes over 250 stations.
In 2016, Ed Garnero from Arizona State University’s School of Earth & Space Exploration (TEDxManhattanBeach talk: An amazing look into the center of the earth) and a team used this trove of seismological data to delve into an ongoing mantle mystery. For decades, geophysicists had observed seismic waves slowing down in two areas beneath the crust on roughly opposite sides of the Earth: one below the Pacific Ocean and the other below Africa. They discerned that the masses were huge — each the size of a continent, 100 times the height of Mount Everest, and around 1,800 miles beneath the surface. And they assumed the areas were extra-warm, since unusually hot zones can cause waves to slow down. Garnero and his researchers were determined to find out more. “They are the largest parts of our Earth that we [have identified but] know nothing about,” he says.
Garnero’s team looked at the data — and made a major discovery. The giant blobs are not just a different temperature from the rest of the mantle; the researchers think they have a distinctly different chemical composition too. “We see from the seismic waves that go near the boundaries of the blobs that they split into a wave that goes into the blob and slows down, while a wave that continues along the blobs’ outside margin goes at normal speed,” Garnero says. “Scientists believe temperature alone cannot do that, so the blobs being compositionally distinct is the easiest explanation.” Researchers don’t know what the blobs are made of — yet — but they can tell the masses are denser and more stable than what’s around them. And they’re most likely feeding volcanoes. “On Earth above the blobs, there are volcanoes past and present, from small to massive,” Garnero says. For example, the hotspots that formed Hawaii, Samoa and Iceland are all fed by extremely deep plumes of magma that appear to be connected to the blobs.
Which leads to the question: Where did these blobs come from? One intriguing theory is that they’re leftovers from our planet’s formation — remnants of some primordial layer of the Earth that eroded away over billions of years through the power of convection. “Our core ‘cooks’ the mantle rock, which makes up about half of the Earth, from below, causing it to slowly turn and move,” Garnero says. “If you did a timelapse of millions of years of Earth’s rocky mantle, you’d see it swirl around just like smoke moving around a bonfire.” And perhaps some of the material was swirled into forming the continent-sized blobs. Garnero and his team have used the seismic data to construct intriguing images of the Earth that include the mantle blobs, essentially giving us an MRI of our planet.
Inside the Earth’s mantle, heat from the core (in red) cooks the mantle rock (in blue), causing the rock to move like smoke around a bonfire. The motions visualized here would happen over a few million years. Visualization by Dr. Allen K. McNamara of Arizona State University.
Garnero wants to share with the public the thrill of searching inside the Earth. Recently, he and a group of artists from Arizona State University, led by Lance Gharavi, created “Beneath: a journey within,” a film-music-dance performance designed to immerse the public in seismic data. Garnero says the cross-disciplinary collaboration has been exhilarating: “The scientists give the artists a platform to create, and then the artists give the scientists a new way to see their data.” The performance, which featured artists including a bass-playing geophysicist interacting with his data through trip-hop bass-lines and a belly-dancing theoretical astrophysicist embodying seismic waves, is being held inside a 3D theater on campus.
Next for geophysicists: Combing through data from the world’s seismometers to add to the expanding pool of subterranean knowledge. In 2017, an extremely detailed map of the inner Earth was created by a team from Princeton University with the help of one of the world’s fastest supercomputers, Titan, which can perform over 20 quadrillion calculations per second.
This visualization provides another view of the two continent-sized blobs of unknown material, deep within the Earth. Created by geophysicists Scott W. French and Barbara Romanowicz of the Physique du Globe and the Collège de France and UC Berkeley.
As for Garnero, his ambitions are galactic. He and his students are now working “to get the most detailed information out of seismic data,” he says, including revisiting an earlier study of the moon that confirmed it has a solid, iron-rich core. His department is also developing a tiny seismometer for NASA to take on a mission to Jupiter’s moon Europa; it would measure tremors on Europa’s crust and possibly locate as-yet-undiscovered bodies of water beneath its icy exterior. Designing such a device is not easy, according to Garnero. Seismometers are ultra-sensitive pieces of equipment, and this machine would need to be sturdy enough to handle a rough spacecraft landing and the other extremes that come with extraterrestrial travel.
The key to future discoveries, either here on or on other spheres, lies in increasing the variety, amount and sensitivity of seismometers. “The more sensors we have, the more we study things like the blobs, and the more other things we can see,” Garnero says. “That’s good for me because that means there are more things to discover.”

Dienstag, 30. Mai 2017