Powered By Blogger

Sonntag, 3. September 2017

LOSSES AFTER QUAKES


Front. Built Environ., 13 June 2017 | https://doi.org/10.3389/fbuil.2017.00030

Losses Associated with Secondary Effects in Earthquakes

The number of earthquakes with high damage and high losses has been limited to around 100 events since 1900. Looking at historical losses from 1900 onward, we see that around 100 key earthquakes (or around 1% of damaging earthquakes) have caused around 93% of fatalities globally. What is indeed interesting about this statistic is that within these events, secondary effects have played a major role, causing around 40% of economic losses and fatalities as compared to shaking effects. Disaggregation of secondary effect economic losses and fatalities demonstrating the relative influence of historical losses from direct earthquake shaking in comparison to tsunami, fire, landslides, liquefaction, fault rupture, and other type losses is important if we are to understand the key causes post-earthquake. The trends and major event impacts of secondary effects are explored in terms of their historic impact as well as looking to improved ways to disaggregate them through two case studies of the Tohoku 2011 event for earthquake, tsunami, liquefaction, fire, and the nuclear impact; as well as the Chilean 1960 earthquake and tsunami event.

Introduction

Disaggregation of secondary effect economic losses and fatalities demonstrating the relative influence of historical losses from direct earthquake shaking in comparison to tsunami, fire, landslides, liquefactions, fault rupture, and other type losses is important if we are to understand the key causes post-earthquake.
Existing studies have attempted to examine the key causes without putting dollar values to the losses, e.g., Bird and Bommer (2004) studied 50 earthquakes between 1980 and 2003 for all secondary effect types, Keefer (1984) and Rodrıguez et al. (1999) for landslide losses, and NGDC/NOAA (2010) for tsunami losses. Although most historical losses have been earthquake shaking related, the influence of the 2011 Tohoku earthquake has changed the historical percentages significantly for tsunami, just as the 1995 Kobe and 2011 Christchurch earthquakes have with regard to liquefaction. Liquefaction has occurred in many earthquakes but this is also difficult to disaggregate for older historical earthquakes. Fire in 1906 San Francisco and 1923 Great Kanto caused significant losses, but since then, important losses have also occurred in many earthquakes. Landslide losses in Haiyuan 1920, Ancash 1970, El Salvador 2001, Kashmir 2005, and Sichuan 2008 were dominant in the database, with many other incidents causing minor damages. Quite often for smaller events, landslides deliver a great amount of the clean-up cost, and indeed sectoral losses. Infrastructure, such as roads, is particularly vulnerable to landslides and secondary effects, often causing much of the damage (i.e., Kaikoura 2016).
This paper sets out to examine the percentage of socioeconomic losses of the secondary effects as compared to primary effects of earthquakes. It also sets out to examine the way in which secondary losses have been counted in past disasters by examining Tohoku 2011 and Chile 1960 in a fact-finding approach. (...)


NORTH KOREA'S NUCLEAR TESTS


How earthquake scientists eavesdrop on North Korea’s nuclear blasts


Waves and ripples in the Earth can reveal the location and depth of an explosion

By
12:00pm, July 25, 2017
illustration of seismic waves under a mountain
NUCLEAR SHAKEDOWN  Rumblings of seismic waves reveal clues about North Korea’s nuclear weapons tests, detonated in a mountain.
On September 9 of last year, in the middle of the morning, seismometers began lighting up around East Asia. From South Korea to Russia to Japan, geophysical instruments recorded squiggles as seismic waves passed through and shook the ground. It looked as if an earthquake with a magnitude of 5.2 had just happened. But the ground shaking had originated at North Korea’s nuclear weapons test site.
It was the fifth confirmed nuclear test in North Korea, and it opened the latest chapter in a long-running geologic detective story. Like a police examiner scrutinizing skid marks to figure out who was at fault in a car crash, researchers analyze seismic waves to determine if they come from a natural earthquake or an artificial explosion. If the latter, then scientists can also tease out details such as whether the blast was nuclear and how big it was. Test after test, seismologists are improving their understanding of North Korea’s nuclear weapons program.
The work feeds into international efforts to monitor the Comprehensive Nuclear-Test-Ban Treaty, which since 1996 has banned nuclear weapons testing. More than 180 countries have signed the treaty. But 44 countries that hold nuclear technology must both sign and ratify the treaty for it to have the force of law. Eight, including the United States and North Korea, have not.
To track potential violations, the treaty calls for a four-pronged international monitoring system, which is currently about 90 percent complete. Hydroacoustic stations can detect sound waves from underwater explosions. Infrasound stations listen for low-frequency sound waves rumbling through the atmosphere. Radio­nuclide stations sniff the air for the radioactive by-products of an atmospheric test. And seismic stations pick up the ground shaking, which is usually the fastest and most reliable method for confirming an underground explosion.
Seismic waves offer extra information about an explosion, new studies show. One research group is exploring how local topography, like the rugged mountain where the North Korean government conducts its tests, puts its imprint on the seismic signals. Knowing that, scientists can better pinpoint where the explosions are happening within the mountain — thus improving understanding of how deep and powerful the blasts are. A deep explosion is more likely to mask the power of the bomb.
Story continues after map

map of North Korea
EARS TO THE GROUND Using seismic wave data, researchers calculated the likely locations of five nuclear tests in North Korea’s Mount Mantap (satellite image shown).
  S.J. GIBBONS ET AL/GEOPHYS. J. INT. 2017, GOOGLE EARTH

Separately, physicists have conducted an unprecedented set of six explosions at the U.S. nuclear test site in Nevada. The aim was to mimic the physics of a nuclear explosion by detonating chemical explosives and watching how the seismic waves radiate outward. It’s like a miniature, nonnuclear version of a nuclear weapons test. Already, the scientists have made some key discoveries, such as understanding how a deeply buried blast shows up in the seismic detectors.
The more researchers can learn about the seismic calling card of each blast, the more they can understand international developments. That’s particularly true for North Korea, where leaders have been ramping up the pace of military testing since the first nuclear detonation in 2006. On July 4, the country launched its first confirmed ballistic missile — with no nuclear payload — that could reach as far as Alaska.
“There’s this building of knowledge that helps you understand the capabilities of a country like North Korea,” says Delaine Reiter, a geophysicist with Weston Geophysical Corp. in Lexington, Mass. “They’re not shy about broadcasting their testing, but they claim things Western scientists aren’t sure about. Was it as big as they claimed? We’re really interested in understanding that.”

Natural or not

Seismometers detect ground shaking from all sorts of events. In a typical year, anywhere from 1,200 to 2,200 earthquakes of magnitude 5 and greater set off the machines worldwide. On top of that is the unnatural shaking: from quarry blasts, mine collapses and other causes. The art of using seismic waves to tell one type of event from the others is known as forensic seismology.
Forensic seismologists work to distinguish a natural earthquake from what could be a clandestine nuclear test. In March 2003, for instance, seismometers detected a disturbance coming from near Lop Nor, a dried-up lake in western China that the Chinese government, which signed but hasn’t ratified the test ban treaty, has used for nuclear tests. Seismologists needed to figure out immediately what had happened.
One test for telling the difference between an earthquake and an explosion is how deep it is. Anything deeper than about 10 kilometers is almost certain to be natural. In the case of Lop Nor, the source of the waves seemed to be located about six kilometers down — difficult to tunnel to, but not impossible. Researchers also used a second test, which compares the amplitudes of two different kinds of seismic waves.
Earthquakes and explosions generate several types of seismic waves, starting with P, or primary, waves. These waves are the first to arrive at a distant station. Next come S, or secondary, waves, which travel through the ground in a shearing motion, taking longer to arrive. Finally come waves that ripple across the surface, including those called Rayleigh waves.

Blasts get bigger

Seismograms of the North Korean nuclear tests show the magnitude of shaking from each and the approximate kilotons of energy released. The 1945 Hiroshima bomb was about 15 kilotons.

S. GIBBONS/NORSAR
In an explosion as compared with an earthquake, the amplitudes of Rayleigh waves are smaller than those of the P waves. By looking at those two types of waves, scientists determined the Lop Nor incident was a natural earthquake, not a secretive explosion. (Seismology cannot reveal the entire picture. Had the Lop Nor event actually been an explosion, researchers would have needed data from the radionuclide monitoring network to confirm the blast came from nuclear and not chemical explosives.)
For North Korea, the question is not so much whether the government is setting off nuclear tests, but how powerful and destructive those blasts might be. In 2003, the country withdrew from the Treaty on the Nonproliferation of Nuclear Weapons, an international agreement distinct from the testing ban that aims to prevent the spread of nuclear weapons and related technology. Three years later, North Korea announced it had conducted an underground nuclear test in Mount Mantap at a site called Punggye-ri, in the northeastern part of the country. It was the first nuclear weapons test since India and Pakistan each set one off in 1998.
By analyzing seismic wave data from monitoring stations around the region, seismologists concluded the North Korean blast had come from shallow depths, no more than a few kilometers within the mountain. That supported the North Korean government’s claim of an intentional test. Two weeks later, a radionuclide monitoring station in Yellowknife, Canada, detected increases in radioactive xenon, which presumably had leaked out of the underground test site and drifted eastward. The blast was nuclear.
But the 2006 test raised fresh questions for seismologists. The ratio of amplitudes of the Rayleigh and P waves was not as distinctive as it usually is for an explosion. And other aspects of the seismic signature were also not as clear-cut as scientists had expected.
Researchers got some answers as North Korea’s testing continued. In 2009, 2013 and twice in 2016, the government set off more underground nuclear explosions at Punggye-ri. Each time, researchers outside the country compared the seismic data with the record of past nuclear blasts. Automated computer programs “compare the wiggles you see on the screen ripple for ripple,” says Steven Gibbons, a seismologist with the NORSAR monitoring organization in Kjeller, Norway. When the patterns match, scientists know it is another test. “A seismic signal generated by an explosion is like a fingerprint for that particular region,” he says.
With each test, researchers learned more about North Korea’s capabilities. By analyzing the magnitude of the ground shaking, experts could roughly calculate the power of each test. The 2006 explosion was relatively small, releasing energy equivalent to about 1,000 tons of TNT — a fraction of the 15-kiloton bomb dropped by the United States on Hiroshima, Japan, in 1945. But the yield of North Korea’s nuclear tests crept up each time, and the most recent test, in September 2016, may have exceeded the size of the Hiroshima bomb.

This U.S. atmospheric nuclear test took place in April 1953 in Nevada. No surprise, North Korea’s buried tests are harder to spot.
CTBTO/FLICKR (CC BY 2.0)
Digging deep

For an event of a particular seismic magnitude, the deeper the explosion, the more energetic the blast. A shallow, less energetic test can look a lot like a deeply buried, powerful blast. Scientists need to figure out precisely where each explosion occurred.
Mount Mantap is a rugged granite mountain with geology that complicates the physics of how seismic waves spread. Western experts do not know exactly how the nuclear bombs are placed inside the mountain before being detonated. But satellite imagery shows activity that looks like tunnels being dug into the mountainside. The tunnels could be dug two ways: straight into the granite or spiraled around in a fishhook pattern to collapse and seal the site after a test, Frank Pabian, a nonproliferation expert at Los Alamos National Laboratory in New Mexico, said in April in Denver at a meeting of the Seismological Society of America.
Researchers have been trying to figure out the relative locations of each of the five tests. By comparing the amplitudes of the P, S and Rayleigh waves, and calculating how long each would have taken to travel through the ground, researchers can plot the likely sites of the five blasts. That allows them to better tie the explosions to the infrastructure on the surface, like the tunnels spotted in satellite imagery.
One big puzzle arose after the 2009 test. Analyzing the times that seismic waves arrived at various measuring stations, one group calculated that the test occurred 2.2 kilometers west of the first blast. Another scientist found it only 1.8 kilometers away. The difference may not sound like a lot, Gibbons says, but it “is huge if you’re trying to place these relative locations within the terrain.” Move a couple of hundred meters to the east or west, and the explosion could have happened beneath a valley as opposed to a ridge — radically changing the depth estimates, along with estimates of the blast’s power.
Gibbons and colleagues think they may be able to reconcile these different location estimates. The answer lies in which station the seismic data come from. Studies that rely on data from stations within about 1,500 kilometers of Punggye-ri — as in eastern China — tend to estimate bigger distances between the locations of the five tests when compared with studies that use data from more distant seismic stations in Europe and elsewhere. Seismic waves must be leaving the test site in a more complicated way than scientists had thought, or else all the measurements would agree.

Four ways to verify a nuclear weapons test

Seismic:
170 stations worldwide monitor ground shaking to identify the location, strength and nature of a seismic event.

Hydroacoustic: 11 stations listen in the oceans, where sound waves can propagate far.

Infrasound: 60 stations detect low-frequency sound waves inaudible to humans.

Radionuclide: 80 stations sniff for radioactive particles dispersed in the wind after a test.
When Gibbons’ team corrected for the varying distances of the seismic data, the scientists came up with a distance of 1.9 kilometers between the 2006 and 2009 blasts. The team also pinpointed the other explosions as well. The September 2016 test turned out to be almost directly beneath the 2,205-meter summit of Mount Mantap, the group reported in January in Geophysical Journal International. That means the blast was, indeed, deeply buried and hence probably at least as powerful as the Hiroshima bomb for it to register as a magnitude 5.2 earthquake.
Other seismologists have been squeezing information out of the seismic data in a different way — not in how far the signals are from the test blast, but what they traveled through before being detected. Reiter and Seung-Hoon Yoo, also of Weston Geophysical, recently analyzed data from two seismic stations, one 370 kilometers to the north in China and the other 306 kilometers to the south in South Korea.
The scientists scrutinized the moments when the seismic waves arrived at the stations, in the first second of the initial P waves, and found slight differences between the wiggles recorded in China and South Korea, Reiter reported at the Denver conference. Those in the north showed a more energetic pulse rising from the wiggles in the first second; the southern seismic records did not. Reiter and Yoo think this pattern represents an imprint of the topography at Mount Mantap.
“One side of the mountain is much steeper,” Reiter explains. “The station in China was sampling the signal coming through the steep side of the mountain, while the southern station was seeing the more shallowly dipping face.” This difference may also help explain why data from seismic stations spanning the breadth of Japan show a slight difference from north to south. Those differences may reflect the changing topography as the seismic waves exited Mount Mantap during the test.

Learning from simulations

But there is only so much scientists can do to understand explosions they can’t get near. That’s where the test blasts in Nevada come in.
The tests were part of phase one of the Source Physics Experiment, a $40-million project run by the U.S. Department of Energy’s National Nuclear Security Administration. The goal was to set off a series of chemical explosions of different sizes and at different depths in the same borehole and then record the seismic signals on a battery of instruments. The detonations took place at the nuclear test site in southern Nevada, where between 1951 and 1992 the U.S. government set off 828 underground nuclear tests and 100 atmospheric ones, whose mushroom clouds were seen from Las Vegas, 100 kilometers away.
For the Source Physics Experiment, six chemical explosions were set off between 2011 and 2016, ranging up to 5,000 kilograms of TNT equivalent and down to 87 meters deep. The biggest required high-energy–density explosives packed into a cylinder nearly a meter across and 6.7 meters long, says Beth Dzenitis, an engineer at Lawrence Livermore National Laboratory in California who oversaw part of the field campaign. Yet for all that firepower, the detonation barely registered on anything other than the instruments peppering the ground. “I wish I could tell you all these cool fireworks go off, but you don’t even know it’s happening,” she says.
The explosives were set inside granite rock, a material very similar to the granite at Mount Mantap. So the seismic waves racing outward behaved very much as they might at the North Korean nuclear test site, says William Walter, head of geophysical monitoring at Livermore. The underlying physics, describing how seismic energy travels through the ground, is virtually the same for both chemical and nuclear blasts.

Technicians lower an enormous canister of explosives into the ground in southern Nevada for a chemical explosion — part of the Source Physics Experiment series — to mimic the physics of nuclear blasts.
GARY STRIKER/LAWRENCE LIVERMORE NATIONAL LAB
The results revealed flaws in the models that researchers have been using for decades to describe how seismic waves travel outward from explosions. These models were developed to describe how the P waves compress rock as they propagate from large nuclear blasts like those set off starting in the 1950s by the United States and the Soviet Union. “That worked very well in the days when the tests were large,” Walter says. But for much smaller blasts, like those North Korea has been detonating, “the models didn’t work that well at all.”
Walter and Livermore colleague Sean Ford have started to develop new models that better capture the physics involved in small explosions. Those models should be able to describe the depth and energy release of North Korea’s tests more accurately, Walter reported at the Denver meeting.
A second phase of the Source Physics Experiment is set to begin next year at the test site, in a much more rubbly type of rock called alluvium. Scientists will use that series of tests to see how seismic waves are affected when they travel through fragmented rock as opposed to more coherent granite. That information could be useful if North Korea begins testing in another location, or if another country detonates an atomic bomb in fragmented rock.
For now, the world’s seismologists continue to watch and wait, to see what the North Korean government might do next. Some experts think the next nuclear test will come at a different location within Mount Mantap, to the south of the most recent tests. If so, that will provide a fresh challenge to the researchers waiting to unravel the story the seismic waves will tell.
“It’s a little creepy what we do,” Reiter admits. “We wait for these explosions to happen, and then we race each other to find the location, see how big it was, that kind of thing. But it has really given us a good look as to how [North Korea’s] nuclear program is progressing.” Useful information as the world’s nations decide what to do about North Korea’s rogue testing.

This story appears in the August 5, 2017, issue of Science News with the headline, "Spying on Nuclear Blasts: Seismologists track down clues to North Korea’s underground weapons testing."
Citations
W.R. Walter and S.R. Ford. Applying insights from the Nevada Source Physics Experiments to the DPRK declared nuclear test seismic signals. Seismological Society of America meeting, Denver, April 19, 2017.
F.V. Pabian and D. Coblentz. Surface disturbances at the Punggye-ri nuclear test site: another indicator of nuclear testing? Los Alamos National Laboratory report posted to 38north.org, final version issued March 15, 2017.
S.J. Gibbons et al. Accurate relative location estimates for the North Korean nuclear tests using empirical slowness corrections. Geophysical Journal International. Vol. 208, January 2017, p. 101. doi:10.1093/gji/ggw379.
C.M. Snelson et al. Chemical explosion experiments to improve nuclear test monitoring. Eos. Vol. 94, July 2, 2013, p. 237. doi:10.1002/2013EO270002.
S.R. Ford and W.R. Walter. An explosion model comparison with insights from the Source Physics Experiments. Bulletin of the Seismological Society of America. Vol. 103, October 2013, p. 2937. doi:10.1785.0120130035.
https://www.sciencenews.org/article/earthquakes-north-korea-nuclear-testing

TSUNAMI RISK FOR CHILE'S COAST

Tsunami Records Show Increased Hazards for Chile’s Central Coast

Simulations of the historical quake raise new concerns: A similar event in the future could cause a devastating tsunami in Chile’s most populated coastal region.
Source: Journal of Geophysical Research: Solid Earth
By
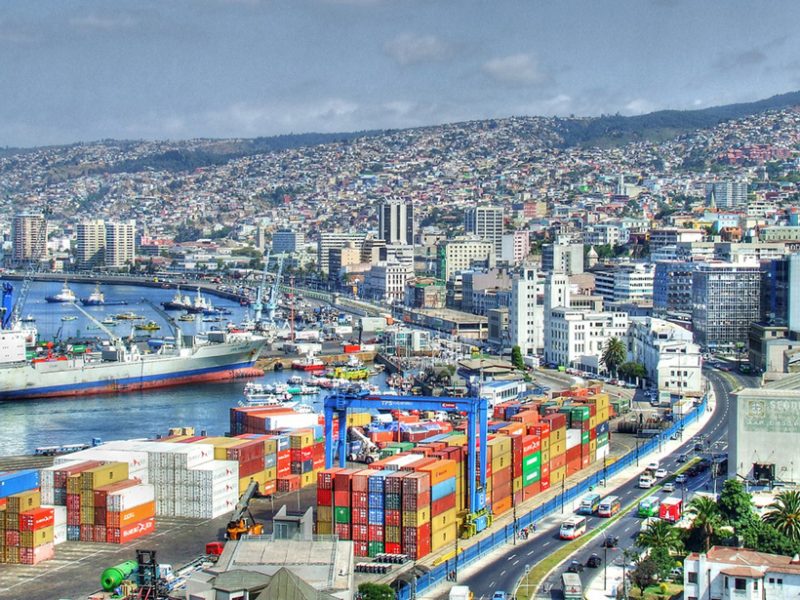
In the early morning of 8 July 1730, residents of central coastal Chile felt what would later be known as the largest earthquake to strike this region since the beginning of local written history (around 1540). The tremor destroyed buildings along more than 1000 kilometers of the coast. Researchers previously thought that the quake may have reached a magnitude of Mw 8.5 to 9.0.
Now Carvajal et al. suggest that this historical quake was even larger than previous estimates and likely reached a magnitude of more than Mw 9, meaning that it was a truly giant event.
Despite the 1730 tremor’s strength, few people were killed, thanks to a strong foreshock that prompted many to leave their homes before the big one hit. People also survived by fleeing to higher ground when they saw seawater receding—a warning sign of the ensuing tsunami that inundated residential areas.
In fact, historical observations of this tsunami, which also reached Japan, were what prompted the authors to reexamine the quake’s magnitude.
A new study looks at historical accounts to reexamine the damage of Chile’s 1730 earthquake.
An anonymous Jesuit priest’s account of the 1730 earthquake and tsunami and their impact in the city of Concepción (now Penco), Chile. After a similar tsunami event in 1751, the city was relocated to higher ground. The top paragraph reads, “Relation of the pitiful and terrible damage to the city of La Concepción of the kingdom of Chile, caused by the trembling and flooding of the day July 8 of 1730.” Credit: Archivum Romanum Societatis Iesu (Roman Archives of the Society of Jesus). Click image for larger version.
In one account, a Jesuit priest in the historical city of Concepción reported the flooding of several religious and public buildings. In Valparaíso, about 500 kilometers north, first- and second-hand accounts describe the flooding. Records from Japan detail damage to barriers, rice fields, and desiccation ponds where salt was harvested but report no human injuries or deaths.
The researchers used these reports to reconstruct the tsunami’s height and the extent of flooding. They then investigated the size and depth of the earthquake required to generate such a tsunami.
Using contemporary knowledge of tsunami generation and progression, the scientists ran simulations of tsunamis produced by hypothetical earthquakes of varying magnitudes, depths, and slip amounts off the coast of central Chile. They found that a quake of Mw 9.1–9.3 best fits with the historical tsunami records in both Chile and Japan.
According to the best fitting simulation, this earthquake would have occurred along a rupture 600–800 kilometers in length, with an average slip amount of 10 to 14 meters. The tsunami records and additional evidence of coastal uplift suggest that the depth of this slip was shallower toward the northern end of the rupture and deeper to the south.
The researchers note that since 1730, tremors in the same region have involved little slip at shallow depths. Slips at shallow depths are widely agreed to pose the most tsunami hazards, so a lack of shallow slip since 1730 may indicate that stress along the shallow portion of the fault has built up for nearly 300 years.
If this potential shallow stress buildup is released in a future earthquake, the subsequent tsunami could be devastating. The authors point out that such a shallow quake might cause only moderate shaking, which could give the local population a false sense of security.
The researchers recommend that this possibility be used to inform disaster prevention plans in the area, which is home to most of Chile’s coastal population. (Journal of Geophysical Research: Solid Earth, https://doi.org/10.1002/2017JB014063, 2017)
—Sarah Stanley, Freelance Writer
Citation: Stanley, S. (2017), Tsunami records show increased hazards for Chile’s central coast, Eos, 98, https://doi.org/10.1029/2017EO077677. Published on 24 July 2017.
© 2017. The authors. CC BY-NC-ND 3.0

5000 YEARS OF TSUNAMIS IN INDONESIA

Indonesian Cave Reveals Nearly 5,000 Years of Tsunamis

Researchers explore a coastal cave containing layers of sand deposited by 11 prehistoric tsunamis and demonstrate that the time period between massive waves is highly variable.
By
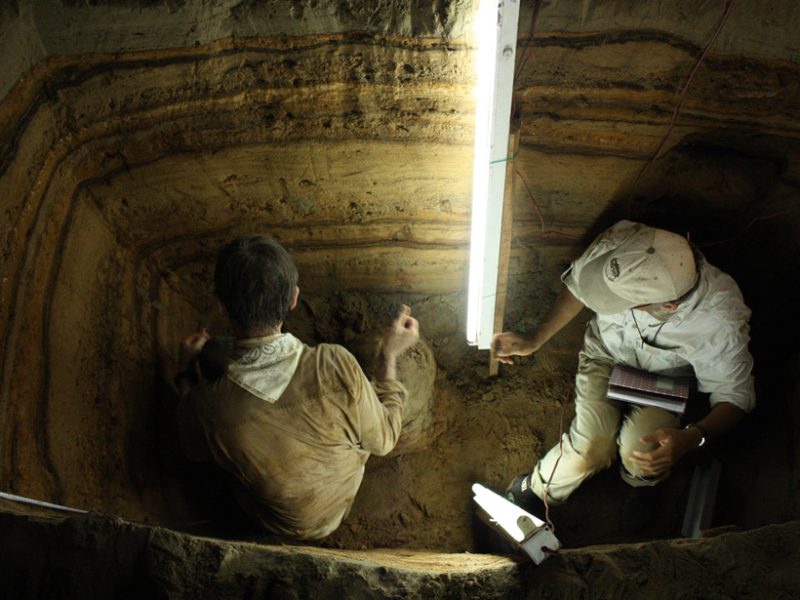
The cave didn’t look that promising from the outside, Charlie Rubin remembers. But when the earthquake geologist and his colleagues walked in and started digging, “our jaws dropped,” he said. The researchers noticed that a depression in the floor of the cave—near Banda Aceh, Indonesia—contained distinct stratigraphy: dark layers of organic material separated by clearly defined layers of lighter-colored sand.
“We looked at each other and wondered if the sand was tsunami sand,” Rubin said. After closer examination, the team members realized they had found a natural record of tsunamis sweeping sand repeatedly into the cave over thousands of years. By radiocarbon dating the sandy layers, the researchers were able to achieve what’s often thought of as a holy grail in tsunami science: a reconstruction of when previous tsunamis occurred thousands of years in the past.

Rubin and his colleagues showed that at least 11 tsunamis had swept over the region over a span of about 5,000 years. But the massive waves were not regular in time: Periods of calm ranged from millennia to merely decades. This finding—that tsunami recurrence intervals are highly variable—is proof that regional hazard mitigation plans should be based on the high likelihood of future destructive tsunamis rather than estimates of recurrence intervals, the team suggests. That’s particularly important in the Indian Ocean, a region that’s prone to megathrust earthquakes and, accordingly, large tsunamis. Those massive waves include the deadliest tsunami in history, which was unleashed in 2004 not far offshore from where the cave is located and which killed more than 200,000 people.
The geological record contained within the Banda Aceh cave is “extraordinary,” said Brian McAdoo, a tsunami scientist at Yale-NUS College in Singapore. This study also represents the first time that cave data have been used to measure tsunami recurrence intervals, McAdoo said.

A Layer Cake

In 2011 and 2012, Rubin and his colleagues excavated six trenches at the rear of the 120-meter-long coastal cave. Beneath a crust of sand topped with bat guano they dug into alternating layers of sand and organic material that reached depths of 2 meters in some places. The scientists carefully collected tiny pieces of charcoal and shells from the layers and radiocarbon dated the material in the laboratory. Using these radiocarbon measurements, the team calculated the most likely age of each of the 11 buried layers of sand and therefore the approximate date of each tsunami.

The researchers found that the 11 sand layers spanned roughly 4,500 years, from about 7,400 to 2,900 years ago. However, the guano-encrusted 12th and uppermost sand layer—which contained shreds of clothing, suggesting it was deposited very recently—differed from the stack of alternating deposits beneath it: Its bottom face was jagged and irregular, unlike the smooth boundaries between the deeper layers.
The scientists suspect that this irregularity resulted from powerful waves from the 2004 tsunami triggered by the Sumatra-Andaman earthquake sweeping into the cave, scraping away previously deposited material, and literally erasing the geological record laid down after 900 BCE. The older layers of sand were probably never disrupted in a similar way because they’re located in a natural depression in the cave, Rubin said. “They’re packed down and they’re protected.”
The research team reported its findings last month in Nature Communications.

Far from Constant

Rubin and his team showed that the time span between successive tsunamis is far from constant: Although 10 intervals within 4,500 years breaks down to an average of 450 years between the events, the researchers found evidence of one 2,000-year period free of tsunamis and also a single century that saw four tsunamis.  “This study provides new evidence that tsunami recurrence can be highly variable,” said Katrin Monecke, a geoscientist at Wellesley College in Wellesley, Mass.
The researchers, who included experts in earthquake science, hypothesized that the thickness of each sand layer reflects the magnitude of the tsunami-causing earthquake because a larger earthquake would produce a larger tsunami and therefore plausibly transport more sand into the cave. According to this theory, the thickest sand layer, measuring roughly 25 centimeters, should correspond to the strongest earthquake that occurred within the nearly 5,000 years of history recorded in the cave.

The scientists inferred that no tsunamis occurred for more than 2,100 years after this thickest layer of sand was laid down. This extremely long interseismic gap is consistent with a period of reduced stress along faults—and therefore of a lower probability of another quake—after a massive temblor released a large amount of energy, the team suggests. Conversely, the researchers found that the four sand layers corresponding to the four tsunamis that occurred within 100 years of each other were all thin (fewer than 10 centimeters), which makes sense, they argued in their paper, because short interseismic periods are consistent with weaker earthquakes.
Rubin said he and his colleagues hope to find additional caves containing evidence of past subduction zone earthquakes. Although other complementary techniques exist for determining that tsunamis occurred in the past, for example, oral histories and chemical analysis, Rubin and his team are excited to literally dig into the past. “The only way to get at tsunami older than historical records is with geology,” Rubin said.
—Katherine Kornei (email: hobbies4kk@gmail.com; @katherinekornei), Freelance Science Journalist
Citation: Kornei, K. (2017), Indonesian cave reveals nearly 5,000 years of tsunamis, Eos, 98, https://doi.org/10.1029/2017EO079283. Published on 07 August 2017.
© 2017. The authors. CC BY-NC-ND 3.0

THE NICARAGUA TSUNAMI 1992


The Legacy of the 1992 Nicaragua Tsunami

A powerful tsunami struck Nicaragua’s Pacific coast 25 years ago. In its wake emerged the first coordinated collaboration among international tsunami scientists.
By , Paula Dunbar, Kelly Stroker, and Laura Kong
On the night of 1 September 1992, a deadly tsunami struck the Pacific coast of Nicaragua with little or no warning, triggered by a nearby earthquake. Early newspaper reports indicated waves almost 15 meters high swept away houses, boats, vehicles, and anything in their path [Globe and Mail, 1992].
The earthquake and tsunami left at least 170 people dead, approximately 500 injured, and more than 13,500 homeless. The tsunami caused most of the damage.
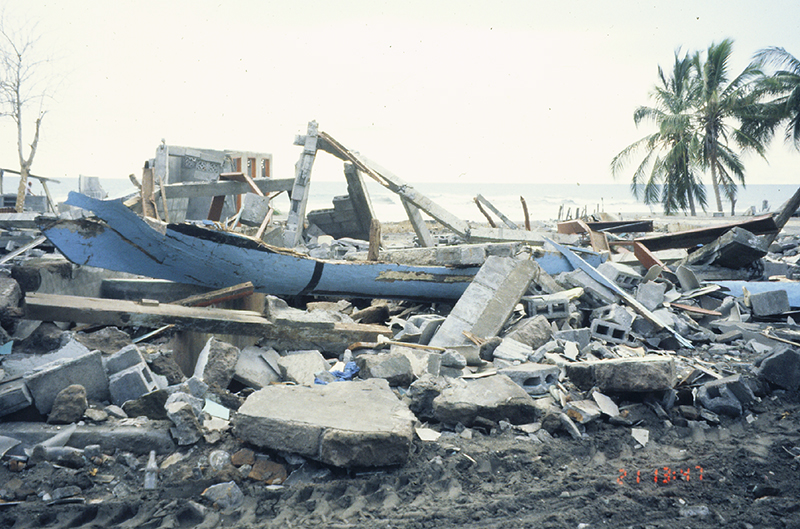
A boat perches on the ruins of a structure in the town of El Transito, Nicaragua. Runups here reached a height of nearly 10 meters.
A boat perches on the ruins of a structure in the town of El Transito, Nicaragua. Runups here reached a height of nearly 10 meters. Credit: Harry Yeh/NCEI
Following the earthquake, the National Oceanic and Atmospheric Administration (NOAA) Pacific Tsunami Warning Center (PTWC) did not issue a tsunami warning. That’s because the earthquake’s initial surface wave magnitude (Ms) was only 6.8 and lower than their warning threshold. However, analysis of seismic signatures would later show that the earthquake’s moment magnitude (Mw), a better representation of the total energy radiated by the earthquake, was 7.7.

Close to the source, many people also underestimated the magnitude of the earthquake on the basis of the shaking. Often, strong earthquake ground shaking serves as a natural warning sign of an impending tsunami, so that coastal communities can evacuate. But in this case the ground shaking was weak or soft. The source was only about 100 kilometers away, so why didn’t many coastal residents feel the earthquake, and why was the ensuing tsunami so high?
The unusual earthquake source characteristics and growing interest in tsunamis in the United States led to the organization of the first International Tsunami Survey Team (ITST) to document the tsunami’s effects. For the 25th anniversary of this event, we interviewed several Japanese and U.S. scientists involved with assessing the tsunami that followed this earthquake. From their accounts, we learned that ascertaining why coastal residents didn’t feel the earthquake greatly improved the ways scientists study tsunami generation and coordinate post-tsunami surveys today.

A Slowly Unrolling Earthquake

In a typical earthquake tsunami sequence, communities near the source feel the earthquake and, if properly alerted to their hazards, brace for the possibility of a tsunami. But the 1992 Nicaragua earthquake, which occurred on 2 September at 00:16 coordinated universal time (1 September at 19:16 local time), did not follow this typical pattern.
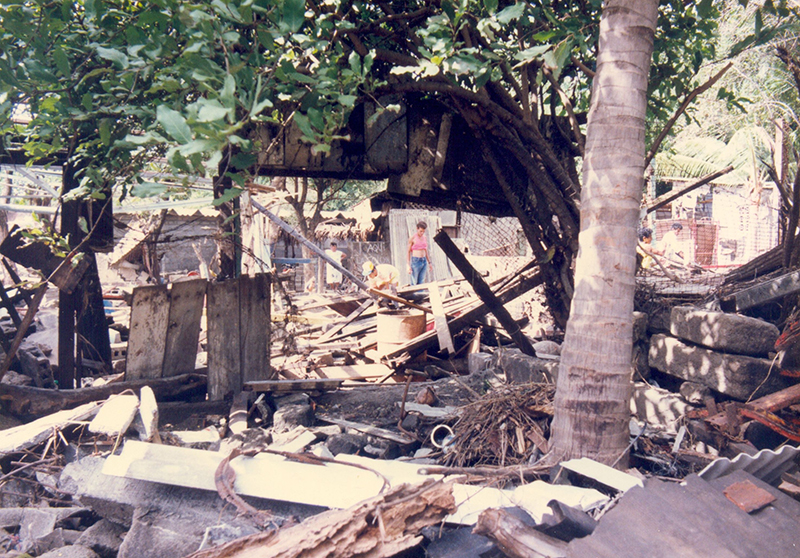
Destruction seen in the town of Masachapa, Nicaragua, the morning after the 1 September 1992 tsunami.
Destruction seen in the town of Masachapa, Nicaragua, the morning after the 1 September 1992 tsunami. Credit: Wilfried Strauch/INETER
“We found only about half the coastal residents actually felt the ground shaking,” recalled Kenji Satake, then a seismologist at the University of Michigan, who participated in the post-tsunami survey.
To understand what happened, one needs to look to a paper published 20 years prior to the events that preceded the 1992 Nicaragua tsunami. In 1972, Hiroo Kanamori, then at Japan’s Earthquake Research Institute of the University of Tokyo, proposed the term “tsunami earthquake“ [Kanamori, 1972]. In such earthquakes, fault rupture occurs more slowly and gradually than it normally would during a typical tectonic earthquake. Measurements of just the short-period seismic waves will not adequately capture this slow release of energy, so a tsunami triggered by such an earthquake is larger and runs up higher than one would expect from quick calculations of Ms.
Prior to 1992, scientists knew about tsunami earthquakes, but they hadn’t really observed seismograms where one unfolded or developed methods for quickly calculating a reliable magnitude when the largest energy is released later. The 1992 earthquake in Nicaragua changed that.
Newly developed broadband seismometers with digital acquisition systems enabled the tracking of the Nicaragua earthquake over multiple frequencies. The seismometers told an intriguing story: “We knew from our seismogram analysis that the source process was unusual, characterized by long duration,” Satake noted.

There it was: The first tsunami earthquake ever recorded by broadband seismometers [Kanamori and Kikuchi, 1993].
In this context, it made sense that many residents didn’t feel the ground shaking. The earthquake was slow, but it packed a big punch that triggered a destructive tsunami where none was expected [Satake, 1994].

The First International Tsunami Survey Team

The gradual release of energy during the 1992 Nicaragua earthquake resulted in underestimated early magnitude assessments because much of the energy was contained in longer-period waves. In 1992, PTWC calculated magnitudes using the 1-second short-period P waves and 20-second period surface waves. Thus, scientists did not know the Ms until 30 to 40 minutes after the earthquake, and when determined, it was below the tsunami warning threshold, recalled Laura Kong, who was on duty at PTWC for the event. As a result, the initial earthquake magnitude calculated did not tip off the scientific community about the possibility of a destructive tsunami.
Because scientists were not tipped off, most of the world outside of Nicaragua heard about the tsunami through news media. Inside the country, however, Wilfried Strauch, a geophysicist at Nicaragua’s Instituto Nicaragüense de Estudios Territoriales (INETER), felt the long earthquake. After hearing on the radio about inundations along the coast, Strauch gathered his equipment and immediately left for the coast. Accompanied by the military, Strauch was among the first scientists and officials to confirm the tsunami’s destruction at sunrise.
A resident assesses damage in San Juan del Sur, Nicaragua, days after the 1 September 1992 tsunami.
A resident assesses damage in San Juan del Sur, Nicaragua, days after the 1 September 1992 tsunami. Credit: Wilfried Strauch/INETER
Fumihiko Imamura, an engineering professor at Tohoku University, was in Japan when he learned of the tsunami from news broadcasts. He had also noted a 7-centimeter rise in a tide gauge moored near Kesennuma, Japan. This blip was the event’s teletsunami, observed more than 12,000 kilometers from its Nicaraguan source. Working backward, far-field tide gauge observations were inverted to estimate the magnitude of the source. These calculations indicated a higher-magnitude earthquake than was initially reported [Satake et al., 1993].
Intrigued, Imamura led one of the survey teams in Nicaragua’s affected areas. His and other teams joined a larger survey effort initiated by Kuniaki Abe (from Nippon Dental University College in Niigata, Japan) and Katsuaki Abe and Yoshinobu Tsuji (from the University of Tokyo’s Earthquake Research Institute, also in Japan). Upon hearing of the survey efforts, Satake contacted the U.S. National Science Foundation (NSF) to request permission to use grant funds to join the survey team in documenting this unusual tsunami. This request led Jody Bourgeois, a program officer at NSF at the time, to link up with the post-tsunami survey teams.
ITST member stands next to a large rock that the 1 September 1992 Nicaragua tsunami carried 50 meters inland.
A photograph taken near the town of Popoyo, Nicaragua, during the first ITST. Here Bourgeois stands next to a large rock that the 1 September 1992 tsunami carried 50 meters inland and deposited 1.85 meters above sea level. Credit: Harry Yeh/NCEI
Through this coordination, the first ITST began to take shape. Scientists and engineers from Japan and the United States, aided by local Nicaraguan scientists and engineers, surveyed the impacted areas within 3 weeks of the event.

International Collaboration

Japan has a long history of tsunami events, and Japanese scientists had done extensive research on tsunami effects before the 1992 Nicaragua event. For instance, Satake was also part of a post-tsunami survey team that documented the 1983 Sea of Japan earthquake and tsunami.
Japanese team members had a great deal of post-tsunami survey experience. In contrast, U.S. team members had little such previous experience. Although U.S. scientists surveyed the effects of the 28 March 1964 Alaska earthquake and tsunami, few destructive tsunamis had hit U.S. coasts in the decade leading up to the Nicaragua event. However, when the Nicaragua tsunami struck, there was growing interest in tsunamis among many U.S. scientists. Recent discoveries in the Cascadia Subduction Zone had revealed a tsunami that we now know struck in 1700, and many scientists were focused on reconstructing that event [Atwater, 1987].
Thus, leadership of the first ITST fell largely to Japanese scientists, given their prior tsunami experience in Japan. The Japanese members handled initial communications with Nicaraguans at INETER and benefited from previously established local connections.

However, as Frank Gonzalez, then an oceanographer at the NOAA Pacific Marine Environmental Laboratory (PMEL), recalled, the level of collaboration “was a first for everyone, so there was a lot of winging it and improvisation.”
One tricky problem to navigate was the availability and accuracy of baseline maps of the coastline. “The Nicaraguans supplied the Japanese team members with maps produced with the help of the Soviet Union,” Bourgeois recalled. “I had a set of maps produced by the U.S. government. The Nicaraguan set was more up to date from on-the-ground data because of cooperation between the Sandinista government and the U.S.S.R. We joked that the two sets were ‘KGB’ and ‘CIA.’”
Nonetheless, she noted that both sets of maps ultimately had issues with accuracy. One survey team member did have a GPS: It “was not very accurate, but then, neither were the maps,” Bourgeois said.

Results from the First ITST Survey

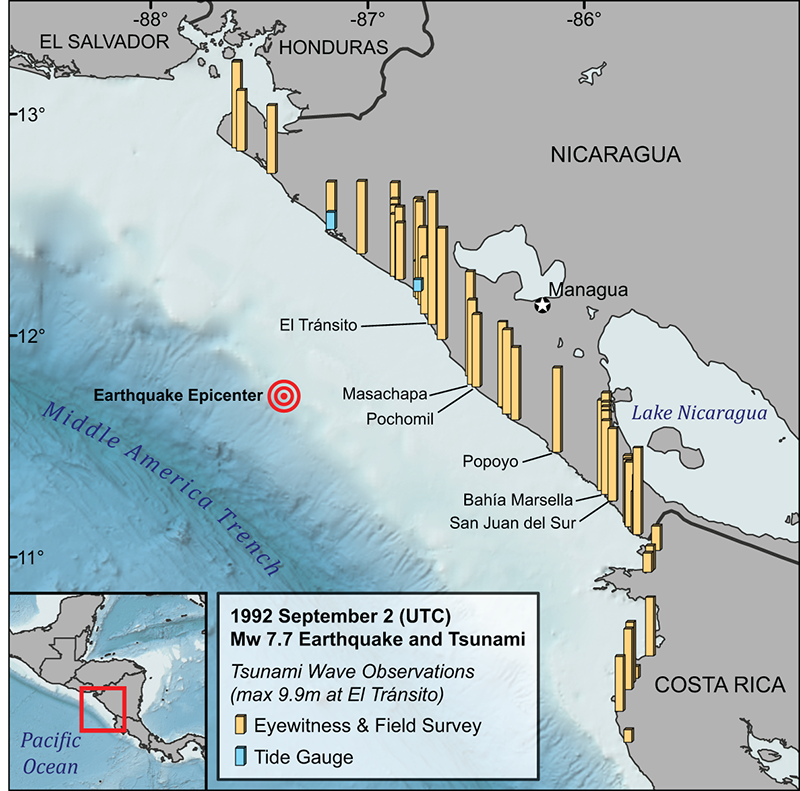
The ITST conducted its survey along more than 250 kilometers of the Nicaraguan coast. They determined the largest wave runups to be along the coast of central Nicaragua. The tsunami reached a height of 9.9 meters at El Tránsito (not 15 meters as reported in newspapers), decreasing to the north and remaining at 6 to 8 meters south to Bahía Marsella (Figure 1). These runup locations are stored in the NOAA National Centers for Environmental Information (NCEI)/World Data Service (WDS) Global Historical Tsunami Database [NCEI/WDS, 2017].
Tsunami wave observations from the 1 September 1992 Nicaragua earthquake and tsunami along the coasts of Nicaragua and Costa Rica.
Fig. 1. Tsunami wave observations from the 1 September 1992 Nicaragua earthquake and tsunami along the coasts of Nicaragua and Costa Rica. The length of bars indicates the relative runup height of the tsunami, with the maximum height of nearly 10 meters observed at El Tránsito, Nicaragua. Data were pulled from the NCEI/WDS Global Historical Tsunami Database. Credit: NCEI
At El Tránsito, 80% of the buildings were swept away. Walls of water were reported at Masachapa, Pochomil, and San Juan del Sur, all of which have shallow ocean depths near the coast. “I was floored by the damage,” reflects Bourgeois. “I was impressed with how building structure had a lot to do with tsunami resilience: open lower floors and houses with breezeways perpendicular to the beach could survive where other houses were obliterated. It wasn’t until I returned in February 1993, though, that I realized that some places where I had seen foundations had actually been standing houses before the tsunami.”
After the 1 September 1992 tsunami in Nicaragua, ITST members note the only two houses in Popoyo that survived.
Three weeks after the 1 September 1992 tsunami in Nicaragua, ITST members document two houses in Popoyo that survived—all the others were washed away. Credit: Harry Yeh/NCEI
Costa Rica also experienced some tsunami damage, and the ITST sent a small group to survey the area. The group faced many challenges, including transport and border crossings that were open irregularly, but they managed to collect and report the data.

An Early Example of a Listserv

After the tsunami, Gonzalez and his team at PMEL developed what is now considered an Internet listserv. The forum, then called the Nicaragua Bulletin Board (or Tsu-Nica), was used to exchange data and manuscripts.

Although these forums are common today, such a listserv was groundbreaking at the time. “It was the beginning of communication among tsunami scientists through the Internet,” Satake said.
This listserv continues today, now called the Tsunami Bulletin Board (TBB). Since 1995, the service has been hosted by the NOAA International Tsunami Information Center (ITIC). The TBB continues to be the main platform for sharing tsunami event information and coordinating post-tsunami surveys. Of course, Tsu-Nica did not solve all coordination and data-sharing problems, but it was an important first step.

Development of a Post-tsunami Survey Field Guide

Three years later, in June 1995, tsunami scientists from 10 countries participated in an International Tsunami Measurements workshop in Estes Park, Colo. This workshop started the development of a post-tsunami survey manual to provide guidance on conducting a survey, including logistics, techniques, and challenges.
In 1998, ITIC and the United Nations Educational, Scientific and Cultural Organization’s Intergovernmental Oceanographic Commission (IOC) published the first edition of the Post-tsunami Survey Field Guide using experience gained from the Nicaragua ITST [IOC, 1998]. Much of the guidance included was based on the work of the first ITST in Nicaragua. For example, Japanese scientists “had a questionnaire which became the basis for future questionnaires,” noted Bourgeois, who attended the 1995 workshop.
Scientists take a core of coastal sediments during a return survey in 1995 to areas affected by the 1992 Nicaragua tsunami.
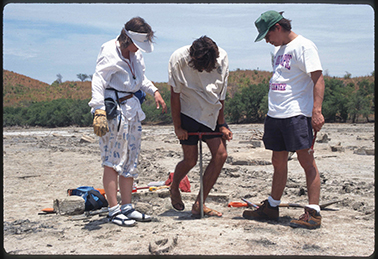
Following the 1992 ITST, Bourgeois returned to Nicaragua twice to study tsunami deposits. This photograph from March 1995 shows Bourgeois (left) in Nicaragua with then University of Southern California researchers José Borrero (middle) and Paul Merculief (right). The scientists are taking a core of coastal sediments to look for tsunami deposits. Credit: Costas Synolakis and ITIC
As the years passed, many scientists contributed to updating the guide, using their experiences from many events. These events include the 2004 Indian Ocean, 2007 Solomon Islands, 2009 Samoa, 2010 Chile, and 2011 Japan tsunamis.

The Legacy of the First Survey

The 1992 ITST focused on collecting water height, maximum inundation, and runup data. In the 25 years since this first survey, much has evolved. Bourgeois was the only sedimentary geologist on the 1992 ITST, but now post-tsunami surveys regularly survey geologic effects (e.g., deposits and erosion) of tsunamis. Social scientists, economists, ecologists, and engineers are now commonly involved in ITSTs. In addition, scientists are gathering eyewitness accounts from those who remember tsunamis that occurred in their childhoods, before modern instrumentation. All these efforts help communities better understand their long-term hazards.

Reflecting on surveys then and now, Gonzalez remarked, “the tsunami community is now much more professionally diverse: not only engineers and oceanographers, but biologists, social scientists, etc. This is as it should be. Tsunamis know no borders, and no single profession can span all tsunami causes and effects.”
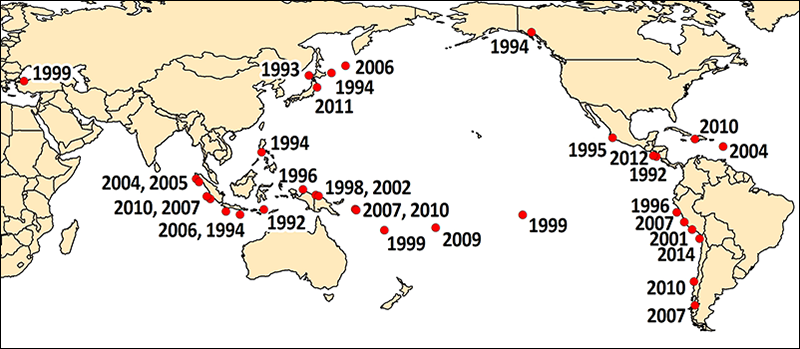
Since 1992, ITSTs have documented a total of 33 tsunami events in the Pacific and Indian oceans and the Caribbean and Mediterranean seas (Figure 2) [IOC, 2014]. To ensure easy access to data, the number of deaths, injuries, economic losses, and buildings damaged reported in ITSTs are now collected in the NCEI/WDS Global Historical Tsunami Database.
Spatial distribution and dates of ITSTs
Fig. 2. Spatial distribution and dates of ITSTs. Credit: NCEI
In short, from scrappy beginnings, a robust, coordinated post-tsunami survey system has emerged.

From Tragedy to Inspiration

The 1992 Nicaragua earthquake and tsunami were tragic events for the people of this Central American country. They brought to focus research on tsunami earthquakes, which remains a “blind spot on local tsunami warnings,” Satake noted. Through the earthquake’s analysis and first ever ITST, scientists took the first steps toward understanding these dangerous events.
A lone wall stands on a foundation in Popoyo 3 weeks after the 1 September 1992 tsunami.
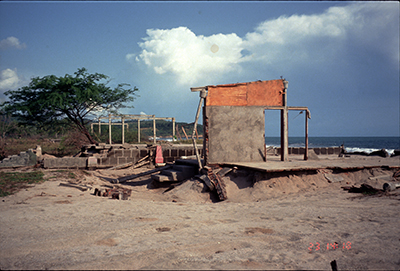
A lone wall stands on a foundation in Popoyo 3 weeks after the 1 September 1992 tsunami. Credit: Harry Yeh/NCEI
From this tragedy, many new systems have grown. The event led to the creation of a national tsunami warning system in Nicaragua, and it planted the seeds of the new Central America Tsunami Advisory Centre (CATAC), a project under development with Japanese support and hosted by Nicaragua’s INETER.
But perhaps the most enduring legacy of the 1992 Nicaragua earthquake and tsunami is their impact on how we now survey tsunamis. Post-tsunami surveys are now coordinated, interdisciplinary, international efforts. In some cases, the affected country may even request IOC and ITIC assist coordination efforts. The collection of perishable tsunami data has benefited from improved measurement capabilities (e.g., differential GPS and integrated laser range finders), leading to a better understanding of tsunamis. Moreover, the ITSTs have underscored to researchers the importance and duty of sharing data with one another through emerging technologies.
Better hazard management stems from coordinated scientific focus. The events 25 years ago in Nicaragua demonstrate this and serve as an enduring example of how collaboration yields information that may ultimately save lives.

References

Atwater, B. F. (1987), Evidence for great Holocene earthquakes along the outer coast of Washington State, Science, 236(4804), 942–944, https://doi.org/10.1126/science.236.4804.942.
Globe and Mail (1992), Tidal waves hit Nicaragua in aftermath of earthquake more than 200 dead or missing as Pacific coast is ravaged, Globe and Mail, 3 Sept.
Intergovernmental Oceanographic Commission (IOC) (1998), Post-tsunami Survey Field Guide, 1st ed., IOC Man. Guides, vol. 37, U. N. Educ., Sci. and Cultural Organ., Paris.
Intergovernmental Oceanographic Commission (IOC) (2014), International Tsunami Survey Team (ITST) Post-tsunami Survey Field Guide, 2nd ed., IOC Man. Guides, vol. 37, U. N. Educ., Sci. and Cultural Organ., Paris.
Kanamori, H. (1972), Mechanism of tsunami earthquakes, Phys. Earth Planet. Inter., 6(5), 346–359, https://doi.org/10.1016/0031-9201(72)90058-1.
Kanamori, H., and M. Kikuchi (1993), The 1992 Nicaragua earthquake: A slow tsunami earthquake associated with subducted sediments, Nature, 361(6414), 714–716, https://doi.org/10.1038/361714a0.
National Centers for Environmental Information/World Data Service (NCEI/WDS) (2017), Global Historical Tsunami Database, Natl. Cent. for Environ. Inf., Boulder, Colo., doi:10.7289/V5PN93H7. [Accessed 7 August 2017.]
Satake, K. (1994), Mechanism of the 1992 Nicaragua tsunami earthquake, Geophys. Res. Lett.21(23), 2519–2522, https://doi.org/10.1029/94GL02338.
Satake, K., et al. (1993), Tsunami field survey of the 1992 Nicaragua earthquake, Eos Trans. AGU74(13), 145, 156–157, https://doi.org/10.1029/93EO00271.

Author Information

Nicolas Arcos (email: nicolas.arcos@noa.gov), Paula Dunbar, and Kelly Stroker, National Centers for Environmental Information, National Oceanic and Atmospheric Administration (NOAA), Boulder, Colo.; also at Cooperative Institute for Research in Environmental Sciences, University of Colorado Boulder; and Laura Kong, International Tsunami Information Center, NOAA, Honolulu, Hawaii

Citation: Arcos, N., P. Dunbar, K. Stroker, and L. Kong (2017), The legacy of the 1992 Nicaragua tsunami, Eos, 98, https://doi.org/10.1029/2017EO080845. Published on 30 August 2017.
© 2017. The authors. CC BY-NC-ND 3.0

MEASURING THE EARTHQUAK'S SIZE

Seismic waves are the vibrations from earthquakes that travel through the Earth; they are recorded on instruments called seismographs. Seismographs record a zig-zag trace that shows the varying amplitude of ground oscillations beneath the instrument. Sensitive seismographs, which greatly magnify these ground motions, can detect strong earthquakes from sources anywhere in the world. The time, location, and magnitude of an earthquake can be determined from the data recorded by seismograph stations.
Modern seismographic systems precisely amplify and record ground motion (typically at periods of between 0.1 and 100 seconds) as a function of time.
Earthquakes with magnitude of about 2.0 or less are usually called microearthquakes; they are not commonly felt by people and are generally recorded only on local seismographs. Events with magnitudes of about 4.5 or greater - there are several thousand such shocks annually - are strong enough to be recorded by sensitive seismographs all over the world. Great earthquakes, such as the 1964 Good Friday earthquake in Alaska, have magnitudes of 8.0 or higher. On the average, one earthquake of such size occurs somewhere in the world each year.

The Richter Scale

Although similar seismographs had existed since the 1890's, it was only in 1935 that Charles F. Richter, a seismologist at the California Institute of Technology, introduced the concept of earthquake magnitude. His original definition held only for California earthquakes occurring within 600 km of a particular type of seismograph (the Woods-Anderson torsion instrument). His basic idea was quite simple: by knowing the distance from a seismograph to an earthquake and observing the maximum signal amplitude recorded on the seismograph, an empirical quantitative ranking of the earthquake's inherent size or strength could be made. Most California earthquakes occur within the top 16 km of the crust; to a first approximation, corrections for variations in earthquake focal depth were, therefore, unnecessary.
The Richter magnitude of an earthquake is determined from the logarithm of the amplitude of waves recorded by seismographs. Adjustments are included for the variation in the distance between the various seismographs and the epicenter of the earthquakes. On the Richter Scale, magnitude is expressed in whole numbers and decimal fractions. For example, a magnitude 5.3 might be computed for a moderate earthquake, and a strong earthquake might be rated as magnitude 6.3. Because of the logarithmic basis of the scale, each whole number increase in magnitude represents a tenfold increase in measured amplitude; as an estimate of energy, each whole number step in the magnitude scale corresponds to the release of about 31 times more energy than the amount associated with the preceding whole number value.
The Richter Scale is not commonly used anymore, except for small earthquakes recorded locally, for which ML and Mblg are the only magnitudes that can be measured. For all other earthquakes, the moment magnitude scale is a more accurate measure of the earthquake size. More on that later.

Magnitude

Richter's original magnitude scale (ML) was extended to observations of earthquakes of any distance and of focal depths ranging between 0 and 700 km. Because earthquakes excite both body waves, which travel into and through the Earth, and surface waves, which are constrained to follow the natural wave guide of the Earth's uppermost layers, two magnitude scales evolved - the mb and MS scales.
The standard body-wave magnitude formula is
mb = log10(A/T) + Q(D,h) ,
where A is the amplitude of ground motion (in microns); T is the corresponding period (in seconds); and Q(D,h) is a correction factor that is a function of distance, D (degrees), between epicenter and station and focal depth, h (in kilometers), of the earthquake. The standard surface-wave formula is
MS = log10 (A/T) + 1.66 log10 (D) + 3.30 .
There are many variations of these formulas that take into account effects of specific geographic regions, so that the final computed magnitude is reasonably consistent with Richter's original definition of ML. Negative magnitude values are permissible.
A rough idea of frequency of occurrence of large earthquakes is given by the following table:
MSEarthquakes per year
8.5 - 8.90.3
8.0 - 8.41.1
7.5 - 7.93.1
7.0 - 7.415
6.5 - 6.956
6.0 - 6.4210

This table is based on data for a recent 47 year period. Perhaps the rates of earthquake occurrence are highly variable and some other 47 year period could give quite different results.
The original mb scale utilized compressional body P-wave amplitudes with periods of 4-5 s, but recent observations are generally of 1 s-period P waves. The MS scale has consistently used Rayleigh surface waves in the period range from 18 to 22 s.
When initially developed, these magnitude scales were considered to be equivalent; in other words, earthquakes of all sizes were thought to radiate fixed proportions of energy at different periods. But it turns out that larger earthquakes, which have larger rupture surfaces, systematically radiate more long-period energy. Thus, for very large earthquakes, body-wave magnitudes badly underestimate true earthquake size; the maximum body-wave magnitudes are about 6.5 - 6.8. In fact, the surface-wave magnitudes underestimate the size of very large earthquakes; the maximum observed values are about 8.3 - 8.7. Some investigators have suggested that the 100 s mantle Love waves (a type of surface wave) should be used to estimate magnitude of great earthquakes. However, even this approach ignores the fact that damage to structure is often caused by energy at shorter periods. Thus, modern seismologists are increasingly turning to two separate parameters to describe the physical effects of an earthquake: seismic moment and radiated energy.
Fault Geometry and Seismic Moment, MO
The orientation of the fault, direction of fault movement, and size of an earthquake can be described by the fault geometry and seismic moment. These parameters are determined from waveform analysis of the seismograms produced by an earthquake. The differing shapes and directions of motion of the waveforms recorded at different distances and azimuths from the earthquake are used to determine the fault geometry, and the wave amplitudes are used to compute moment. The seismic moment is related to fundamental parameters of the faulting process.
MO = µS‹d› ,
where µ is the shear strength of the faulted rock, S is the area of the fault, and <d> is the average displacement on the fault. Because fault geometry and observer azimuth are a part of the computation, moment is a more consistent measure of earthquake size than is magnitude, and more importantly, moment does not have an intrinsic upper bound. These factors have led to the definition of a new magnitude scale MW, based on seismic moment, where
MW = 2/3 log10(MO) - 10.7 .
The two largest reported moments are 2.5 X 1030 dyn·cm (dyne·centimeters) for the 1960 Chile earthquake (MS 8.5; MW 9.6) and 7.5 X 1029 dyn·cm for the 1964 Alaska earthquake (MS 8.3; MW 9.2). MS approaches its maximum value at a moment between 1028 and 1029 dyn·cm.
Energy, E
The amount of energy radiated by an earthquake is a measure of the potential for damage to man-made structures. Theoretically, its computation requires summing the energy flux over a broad suite of frequencies generated by an earthquake as it ruptures a fault. Because of instrumental limitations, most estimates of energy have historically relied on the empirical relationship developed by Beno Gutenberg and Charles Richter:
log10E = 11.8 + 1.5MS
where energy, E, is expressed in ergs. The drawback of this method is that MS is computed from an bandwidth between approximately 18 to 22 s. It is now known that the energy radiated by an earthquake is concentrated over a different bandwidth and at higher frequencies. With the worldwide deployment of modern digitally recording seismograph with broad bandwidth response, computerized methods are now able to make accurate and explicit estimates of energy on a routine basis for all major earthquakes. A magnitude based on energy radiated by an earthquake, Me, can now be defined,
Me = 2/3 log10E - 2.9.
For every increase in magnitude by 1 unit, the associated seismic energy increases by about 32 times.
Although Mw and Me are both magnitudes, they describe different physical properites of the earthquake. Mw, computed from low-frequency seismic data, is a measure of the area ruptured by an earthquake. Me, computed from high frequency seismic data, is a measure of seismic potential for damage. Consequently, Mw and Me often do not have the same numerical value.
Intensity
The increase in the degree of surface shaking (intensity) for each unit increase of magnitude of a shallow crustal earthquake is unknown. Intensity is based on an earthquake's local accelerations and how long these persist. Intensity and magnitude thus both depend on many variables that include exactly how rock breaks and how energy travels from an earthquake to a receiver. These factors make it difficult for engineers and others who use earthquake intensity and magnitude data to evaluate the error bounds that may exist for their particular applications.
An example of how local soil conditions can greatly influence local intensity is given by catastrophic damage in Mexico City from the 1985, MS 8.1 Mexico earthquake centered some 300 km away. Resonances of the soil-filled basin under parts of Mexico City amplified ground motions for periods of 2 seconds by a factor of 75 times. This shaking led to selective damage to buildings 15 - 25 stories high (same resonant period), resulting in losses to buildings of about $4.0 billion and at least 8,000 fatalities.
The occurrence of an earthquake is a complex physical process. When an earthquake occurs, much of the available local stress is used to power the earthquake fracture growth to produce heat rather than to generate seismic waves. Of an earthquake system's total energy, perhaps 10 percent to less that 1 percent is ultimately radiated as seismic energy. So the degree to which an earthquake lowers the Earth's available potential energy is only fractionally observed as radiated seismic energy.
Determining the Depth of an Earthquake
Earthquakes can occur anywhere between the Earth's surface and about 700 kilometers below the surface. For scientific purposes, this earthquake depth range of 0 - 700 km is divided into three zones: shallow, intermediate, and deep.
Shallow earthquakes are between 0 and 70 km deep; intermediate earthquakes, 70 - 300 km deep; and deep earthquakes, 300 - 700 km deep. In general, the term "deep-focus earthquakes" is applied to earthquakes deeper than 70 km. All earthquakes deeper than 70 km are localized within great slabs of shallow lithosphere that are sinking into the Earth's mantle.
The evidence for deep-focus earthquakes was discovered in 1922 by H.H. Turner of Oxford, England. Previously, all earthquakes were considered to have shallow focal depths. The existence of deep-focus earthquakes was confirmed in 1931 from studies of the seismograms of several earthquakes, which in turn led to the construction of travel-time curves for intermediate and deep earthquakes.
The most obvious indication on a seismogram that a large earthquake has a deep focus is the small amplitude, or height, of the recorded surface waves and the uncomplicated character of the P and S waves. Although the surface-wave pattern does generally indicate that an earthquake is either shallow or may have some depth, the most accurate method of determining the focal depth of an earthquake is to read a depth phase recorded on the seismogram.
The most characteristic depth phase is pP. This is the P wave that is reflected from the surface of the Earth at a point relatively near the epicenter. At distant seismograph stations, the pP follows the P wave by a time interval that changes slowly with distance but rapidly with depth. This time interval, pP-P (pP minus P), is used to compute depth-of-focus tables. Using the time difference of pP-P as read from the seismogram and the distance between the epicenter and the seismograph station, the depth of the earthquake can be determined from published travel-time curves or depth tables.
Another seismic wave used to determine focal depth is the sP phase - an S wave reflected as a P wave from the Earth's surface at a point near the epicenter. This wave is recorded after the pP by about one-half of the pP-P time interval. The depth of an earthquake can be determined from the sP phase in the same manner as the pP phase by using the appropriate travel-time curves or depth tables for sP.
If the pP and sP waves can be identified on the seismogram, an accurate focal depth can be determined.
by William Spence, Stuart A. Sipkin, and George L. Choy
Earthquakes and Volcanoes
Volume 21, Number 1, 1989

 https://earthquake.usgs.gov/learn/topics/measure.php?t=1&cn=ZmxleGlibGVfcmVjc18y&refsrc=email&iid=a14d6618cc7248399e8eb5baa382cee6&uid=765318905522946048&nid=244+272699400